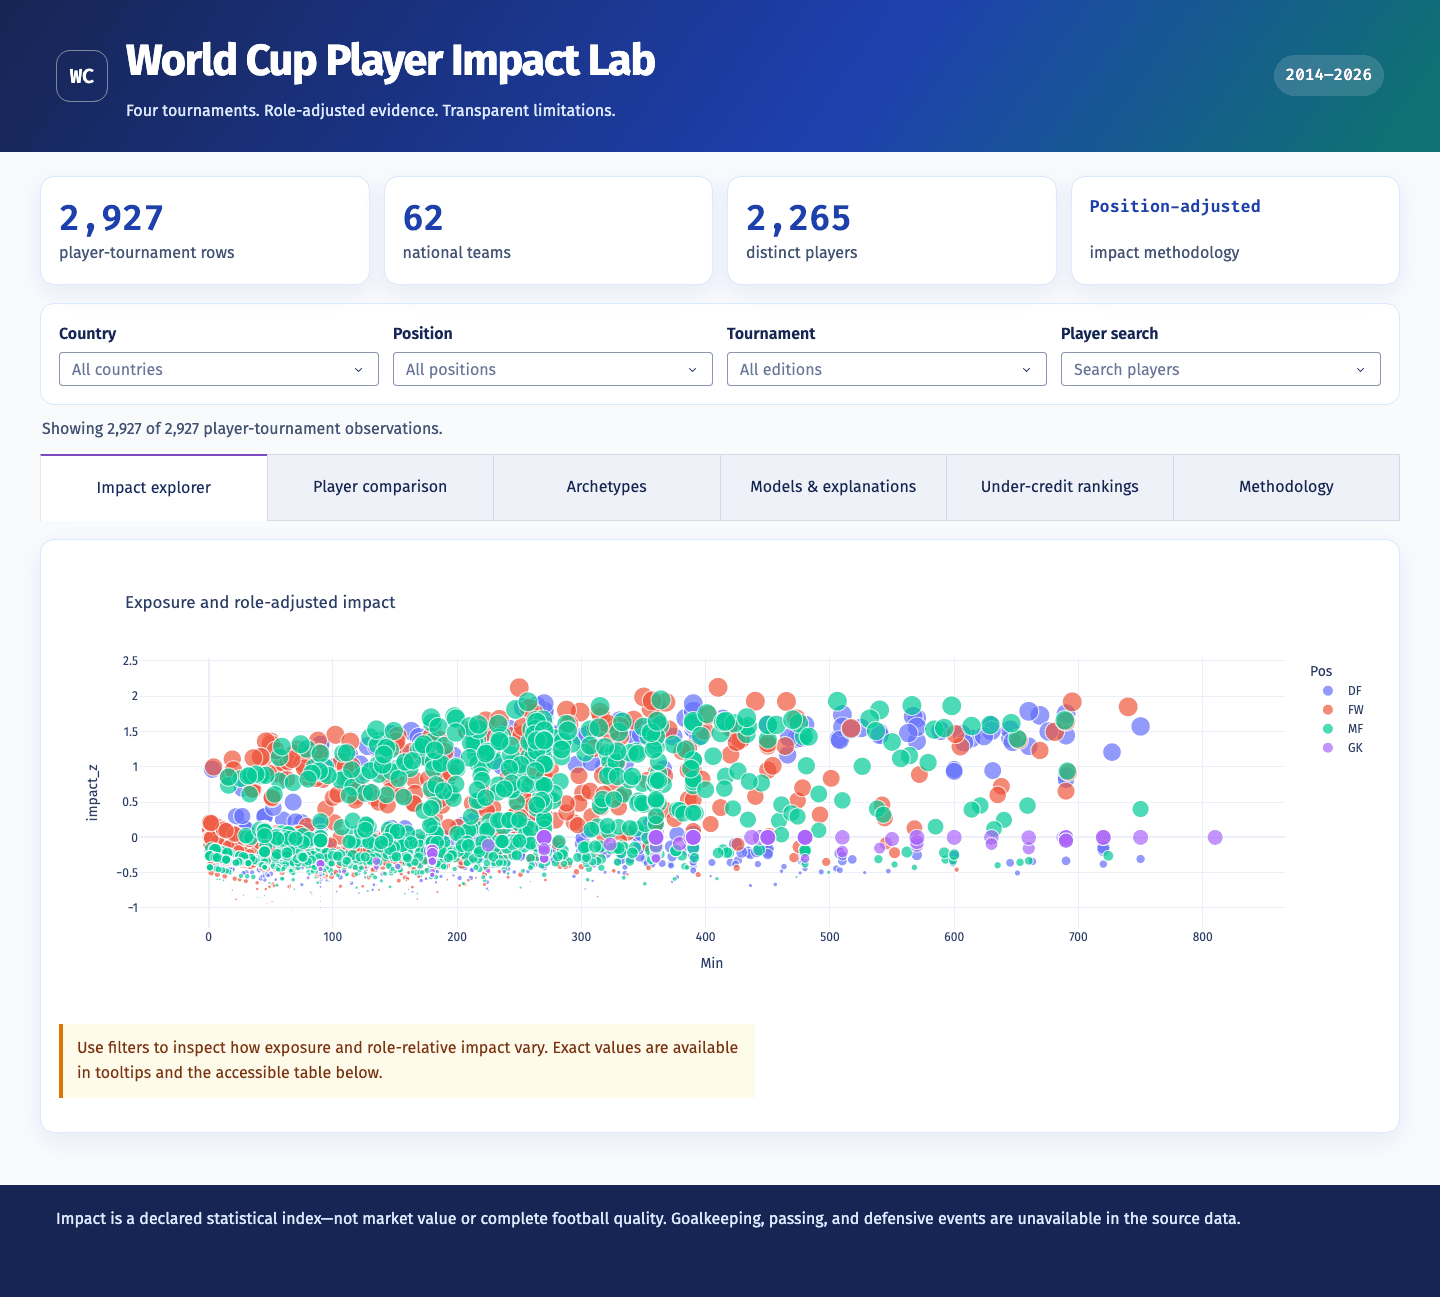
This study analyzes 2,927 player-tournament observations from the 2014, 2018, 2022, and 2026 FIFA World Cups. It asks which observed combinations characterize a declared, role-relative impact index and whether machine learning can identify recorded contributions that a goals-and-assists benchmark under-credits. The analysis combines reliability-adjusted production, availability, discipline, and recorded positional versatility while preserving a strict boundary around what the supplied statistics cannot measure.
Player-tournament observations
2,927Four World Cup editionsDistinct player names
2,265521 observed in multiple editionsNested RMSE
0.063Descriptive score emulationTemporal Ridge R²
0.027423 returning-player transitionsWhich combination of observed player statistics best explains a declared measure of World Cup impact, and can machine learning find player-tournament performances whose recorded contribution exceeds what traditional production alone predicts?
The primary estimand is a transparent player-tournament composite, not latent true ability. “Under-credited” means a positive out-of-fold residual against a traditional production benchmark. It does not mean financially undervalued, underpaid, or underrated by the public.
Dataset
Dataset summary
FIFA World Cup player statistics, 2014-2026
- Observations
- 2,927 player-tournament rows
- Features
- 25 shared source fields
- Target
- Declared role-relative impact index
- Source
- Four supplied tournament CSV files
The harmonized data contain 2,265 distinct player names, 62 countries, and 521 players observed in multiple editions. Shared variables cover identity, age, broad position, squad, appearances, starts, minutes, goals, assists, penalties, cards, a player ID, supplied per-90 rates, and an optional secondary position. Club is available only in the later files.
The player-tournament row remains the unit of analysis. Aggregating entire careers would erase tournament context, team progression, and the position-within-edition reference groups used by the score.
Schema validation checks nonnegative counts, starts not exceeding appearances, penalty consistency, total-statistic identities, per-90 rounding, exact duplicates, and within-edition player-ID uniqueness. The four source files passed the declared impossible-value and consistency checks with zero validation errors.
Measurement
The supplied files do not contain passing, shot attempts, expected goals, defensive actions, recoveries, pressing, possession, progression, match state, opponent strength, goalkeeper actions, injuries, salary, transfer fees, or market valuation. Those questions are marked unavailable instead of being approximated with misleading proxies.
Goalkeepers receive an explicit limitation flag. Without saves, shots faced, claims, distribution, or clean sheets, their score primarily describes availability and discipline rather than comprehensive goalkeeping performance.
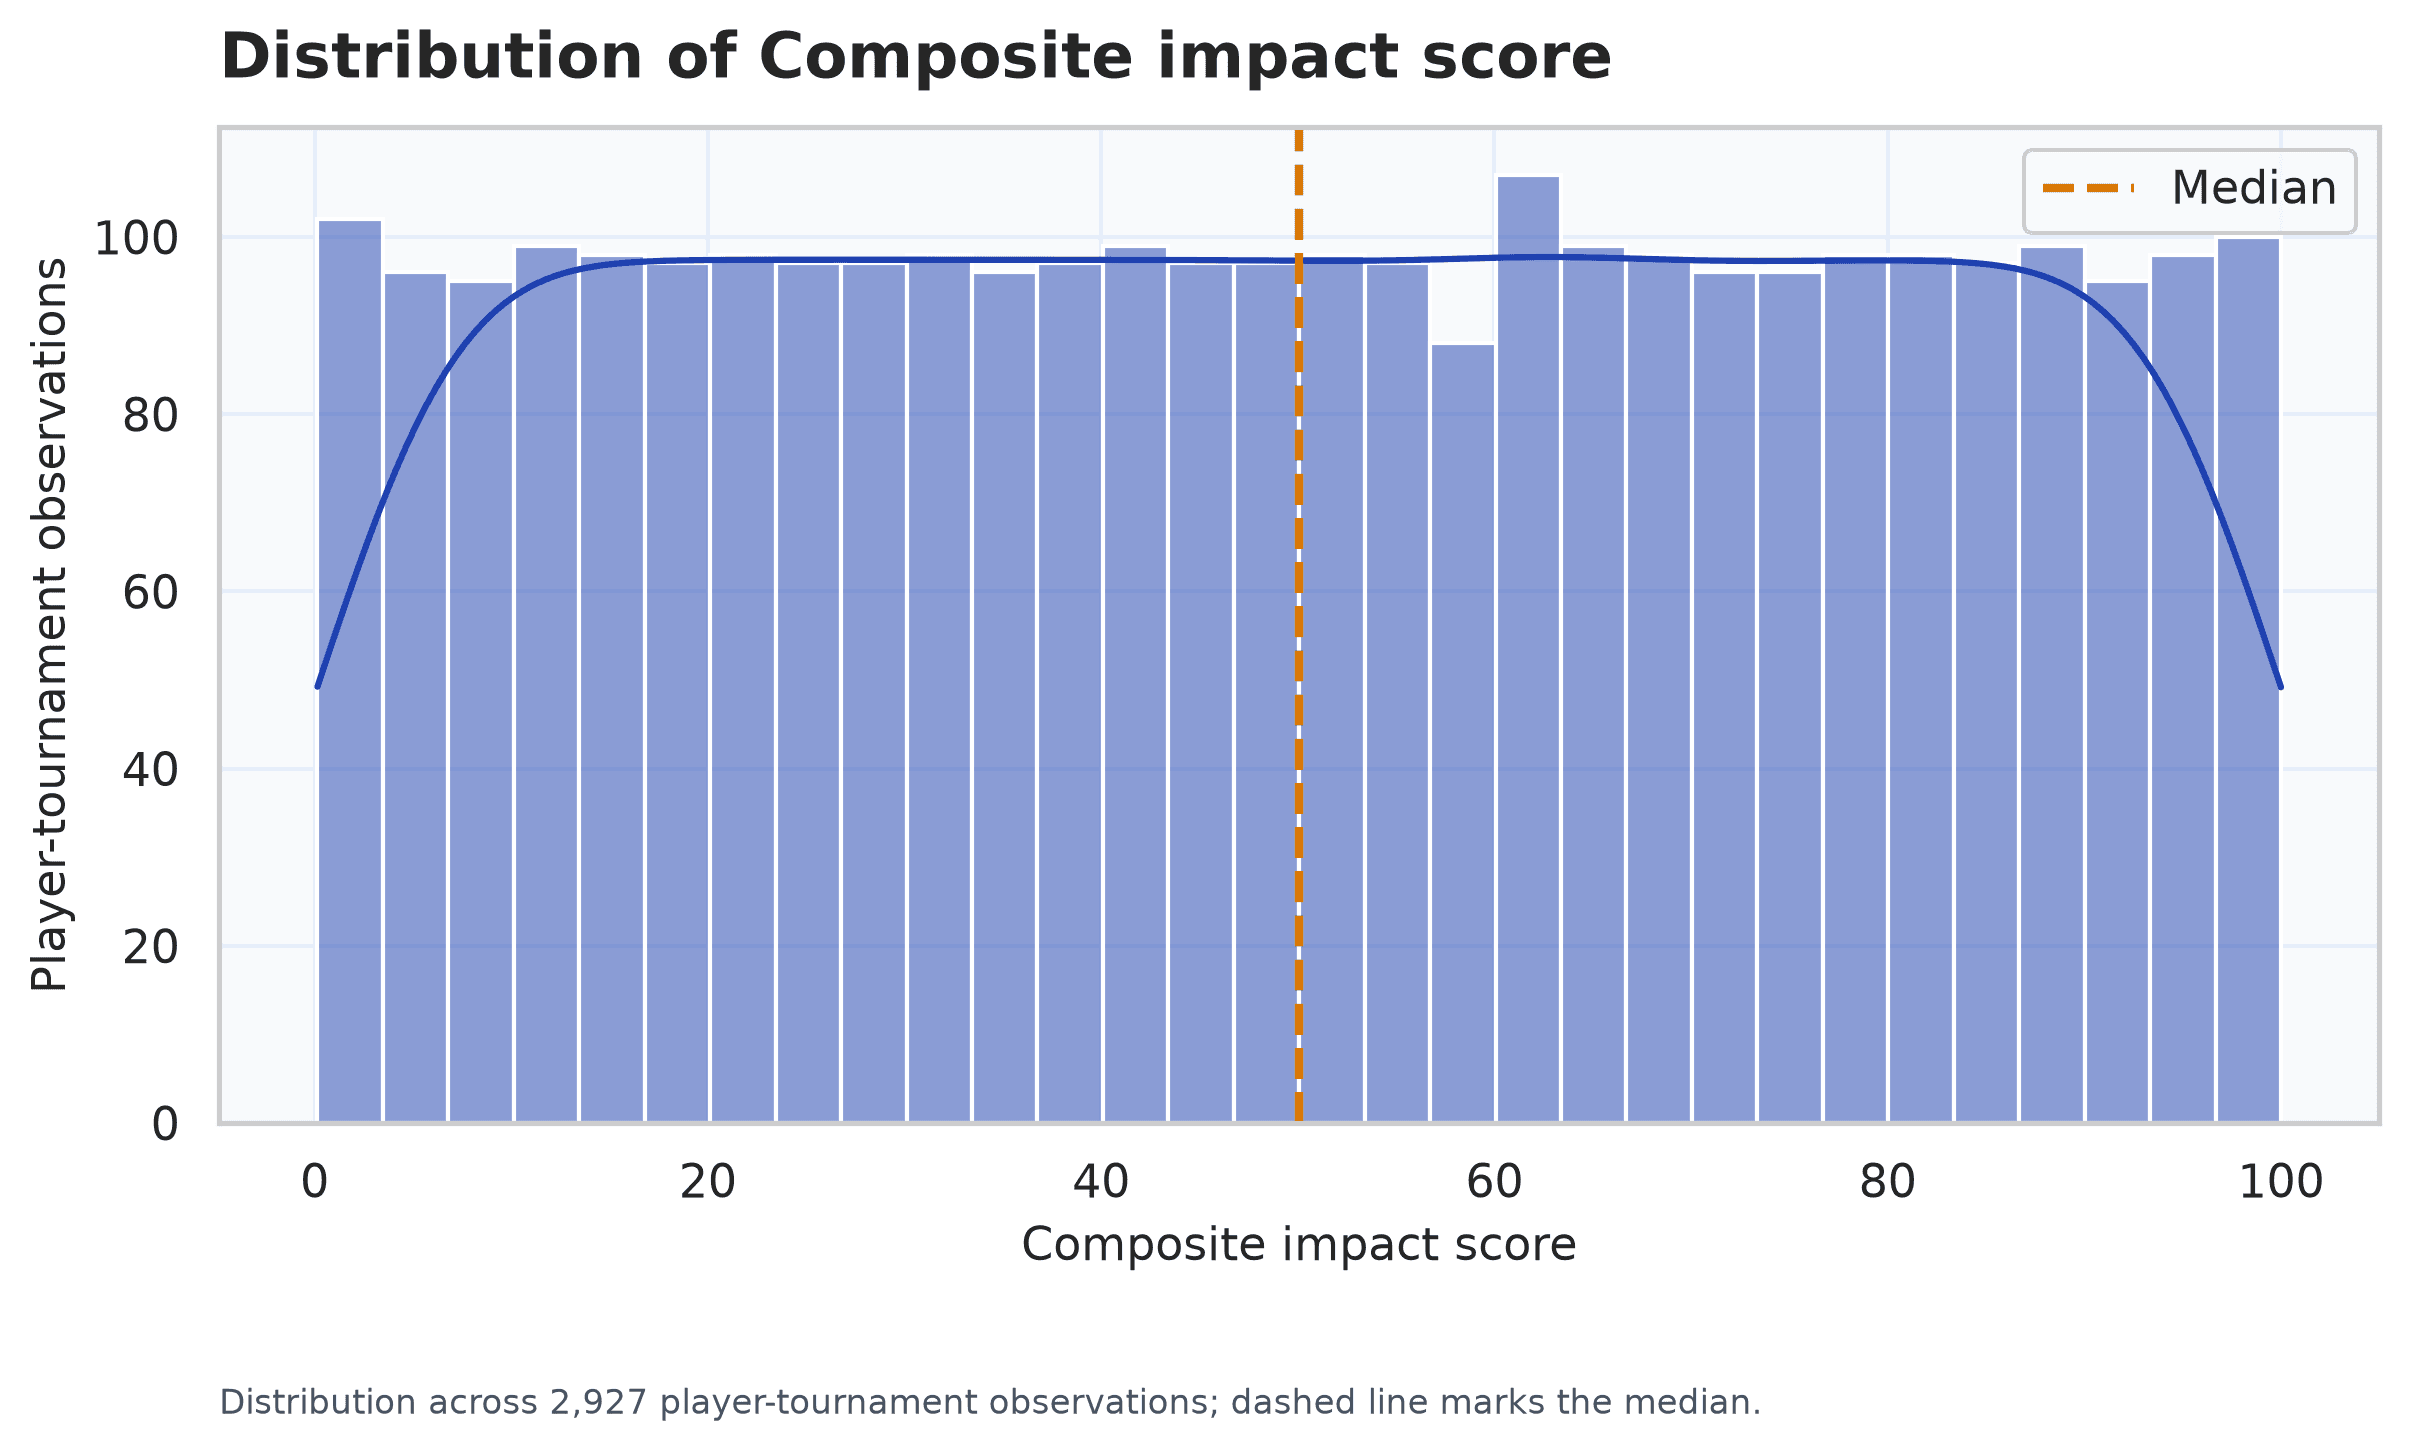
InterpretationThe median composite score is 50.07 and the interquartile range is 49.91, showing a broad distribution with a distinct high-impact tail.
LimitationThis is a descriptive constructed score based only on supplied tournament summaries.
Methodology
Recompute and stabilize rates
Normalize within role and edition
Declare the score
Separate description from prediction
impact_z = 0.45 × production_z + 0.35 × availability_z + 0.10 × discipline_z + 0.10 × versatility_z
Availability is not a pure skill measure. It also reflects selection, fitness, coach trust, team progression, and tournament opportunity. Its inclusion makes the index a tournament-contribution measure rather than a counterfactual talent estimate.
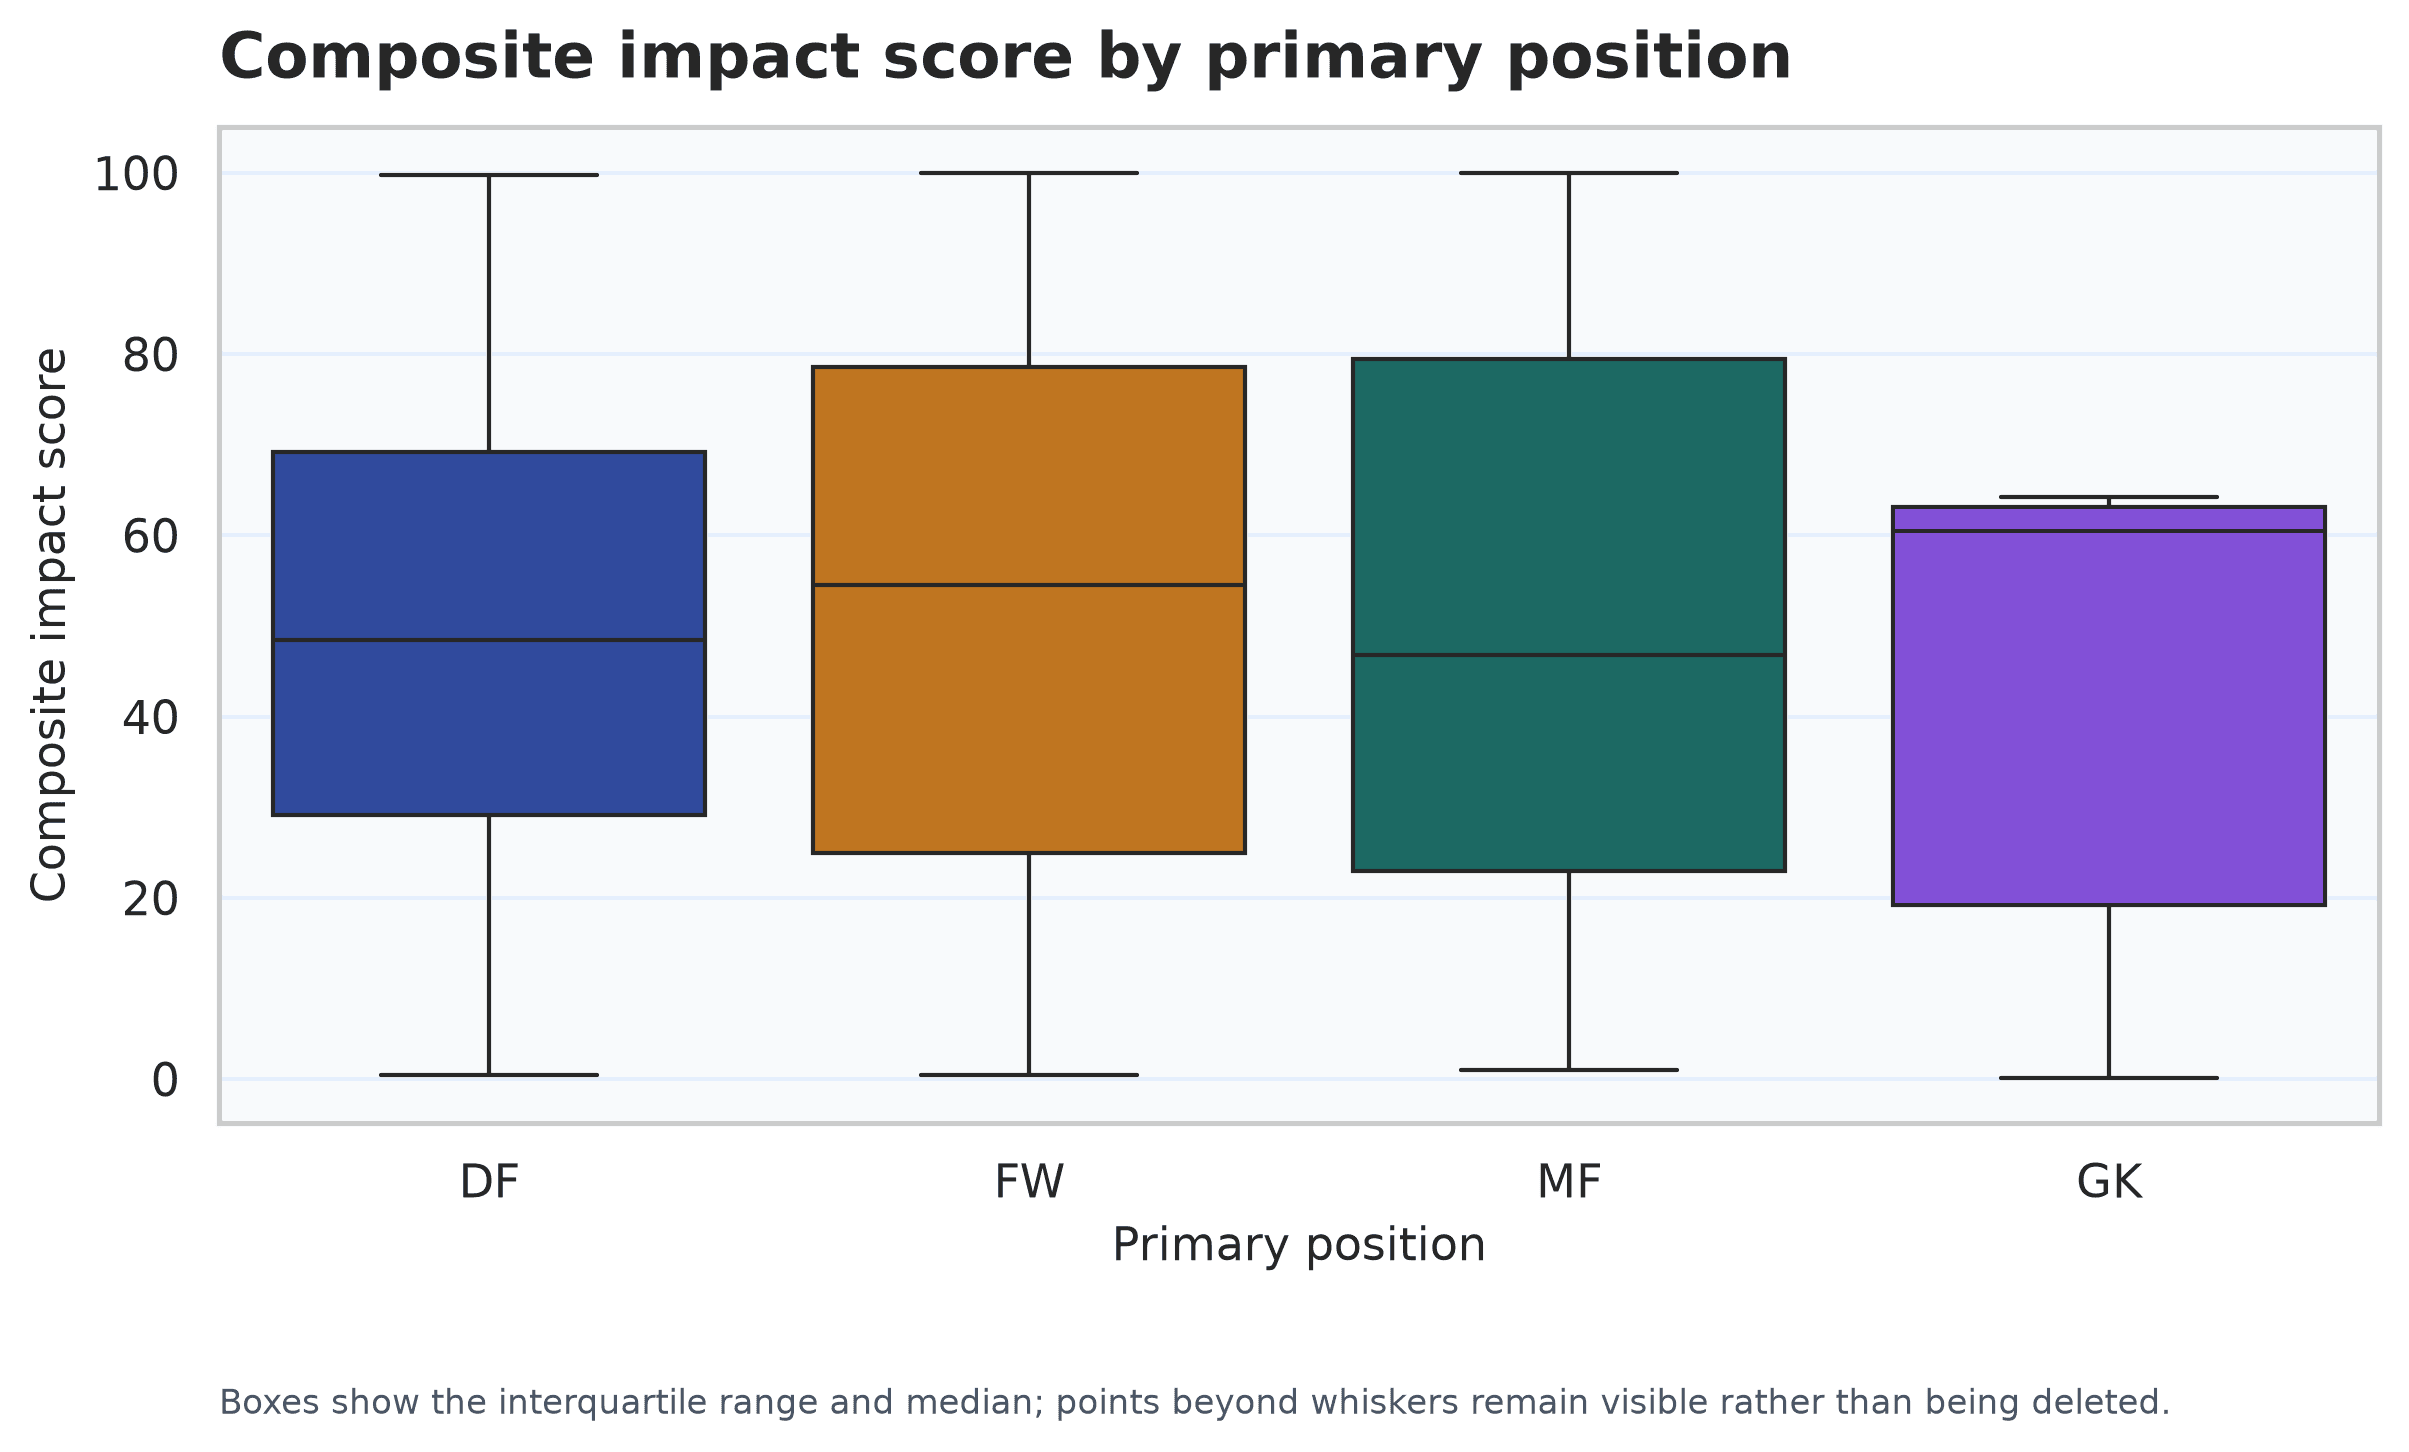
InterpretationThe full observed distributions retain exposure heterogeneity while role-relative standardization supports more careful comparison.
LimitationBroad positions still conceal tactical differences such as wingbacks versus center backs.
Exploratory analysis
Goals and assists are strongly zero-inflated, while minutes and starts reflect both player selection and how far a team progresses. Raw totals, per-90 rates, and reliability-adjusted rates therefore answer different questions and are kept separate.
Position comparisons use classical ANOVA, Welch ANOVA, Kruskal-Wallis tests, Levene diagnostics, pairwise Welch tests, Mann-Whitney tests, effect sizes, confidence intervals, and adjusted p-values. Practical interpretation depends on magnitude and football context rather than statistical significance alone.
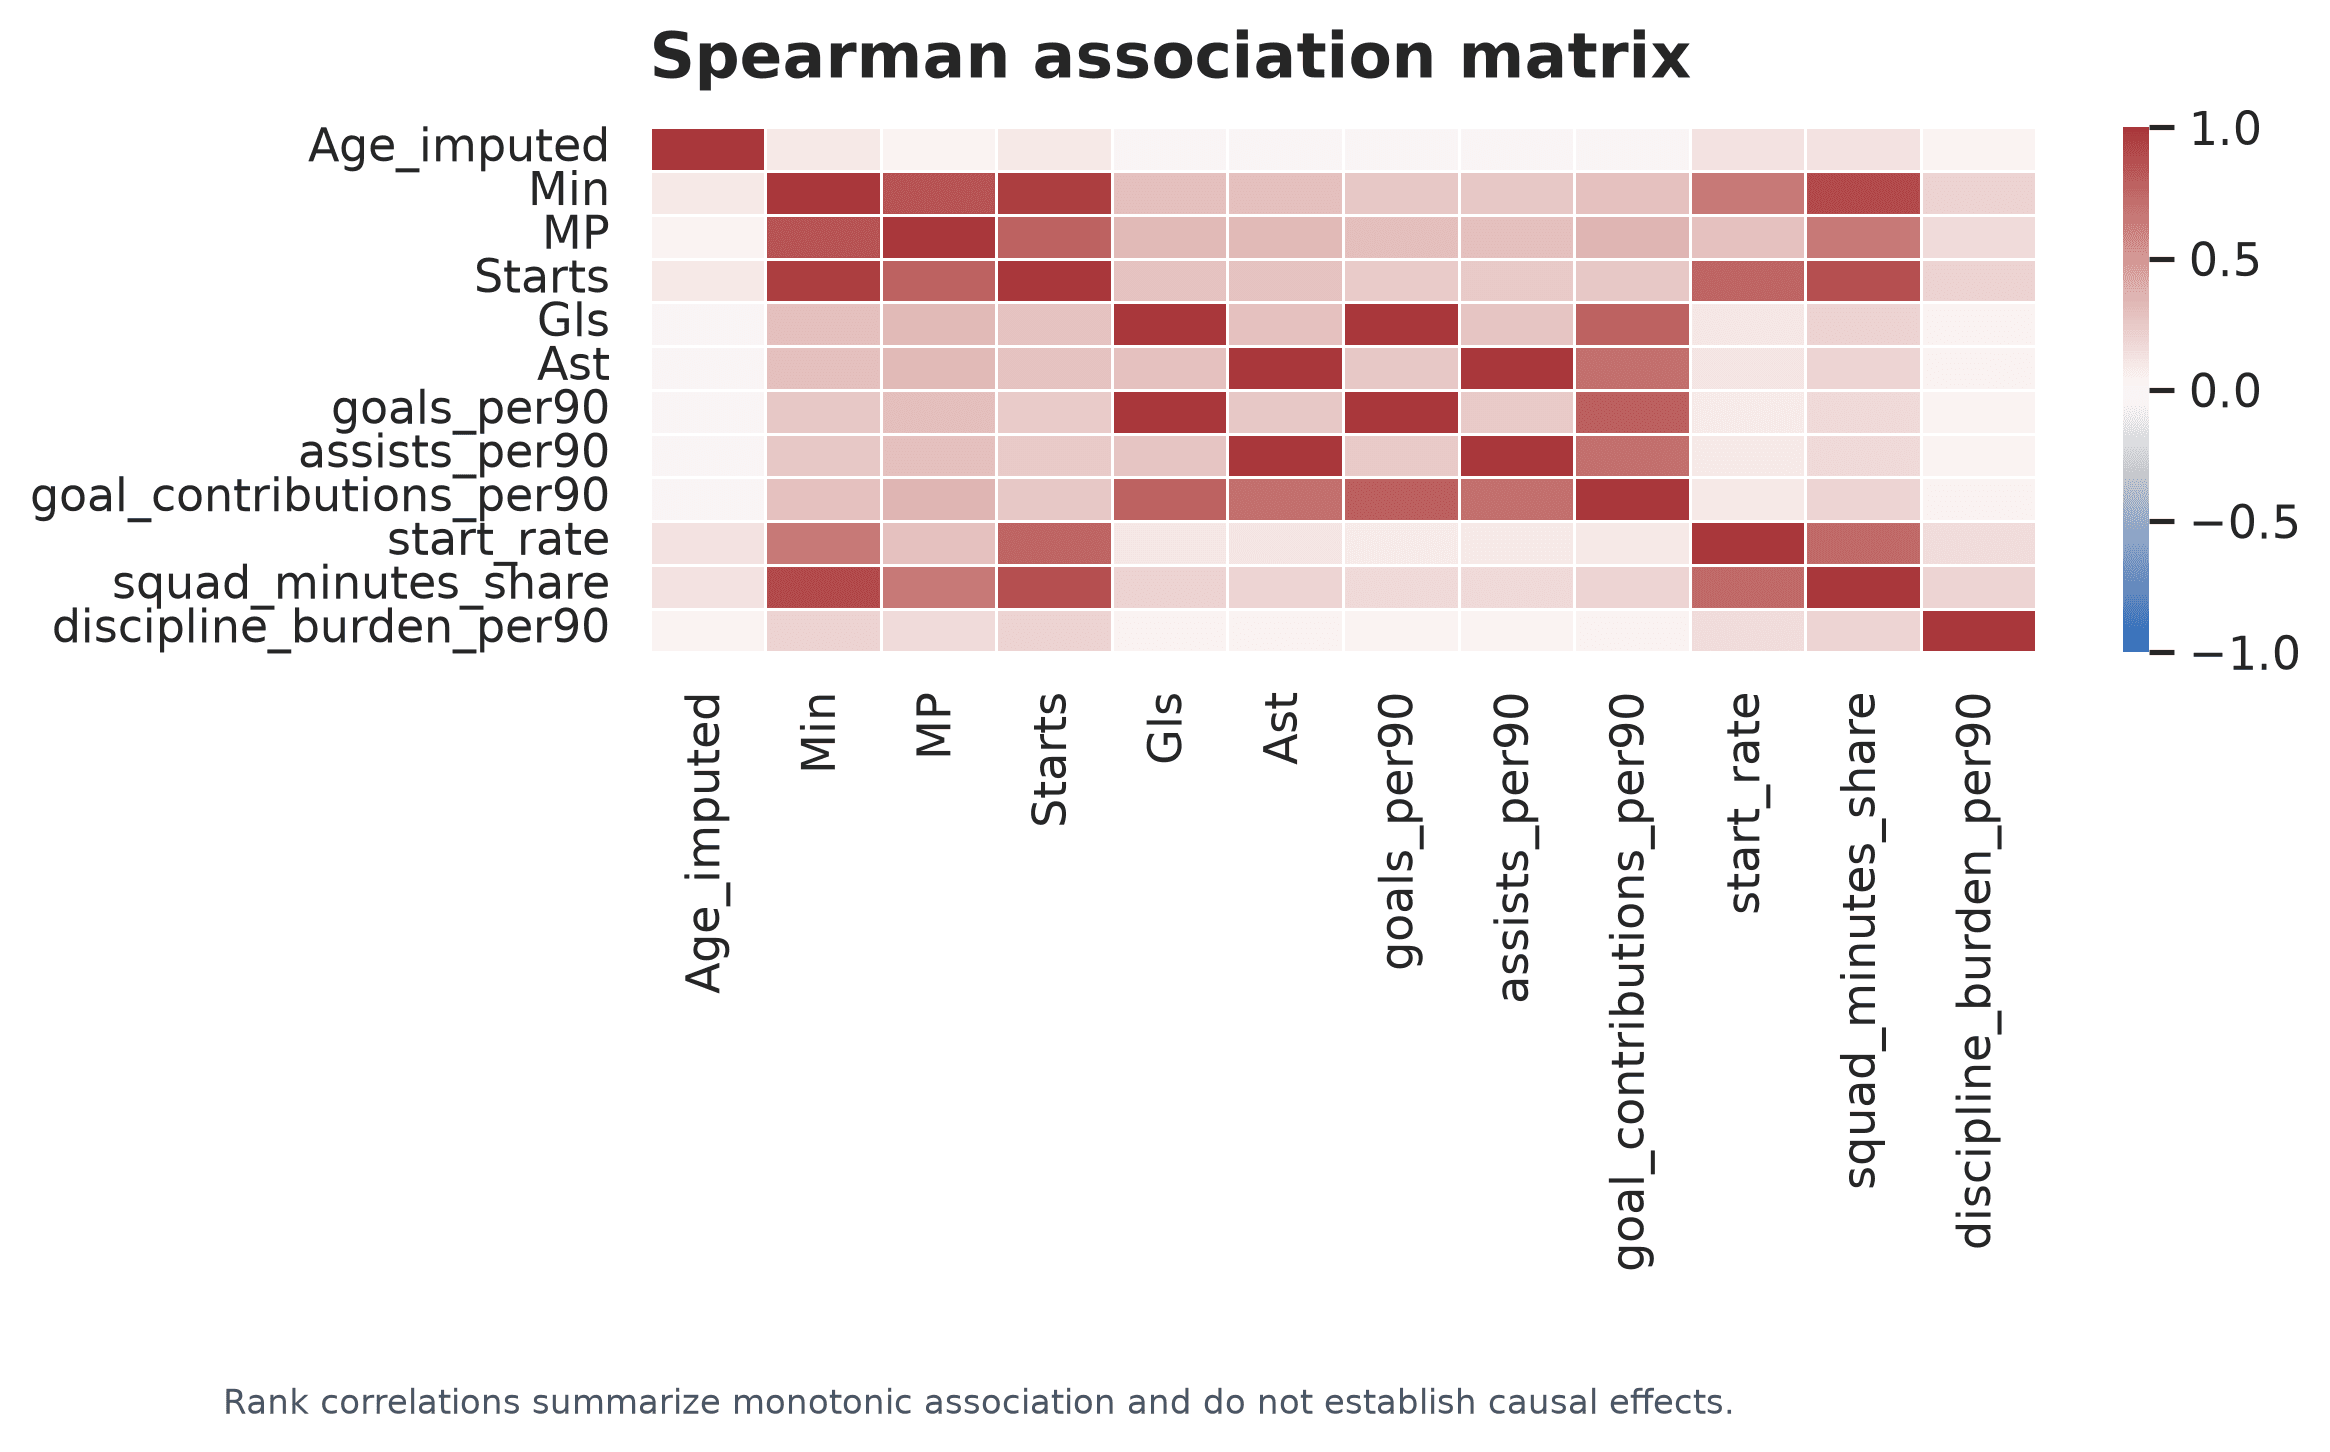
InterpretationLarge absolute cells identify redundancy and expected multicollinearity, particularly where starts and appearances co-move with minutes.
LimitationRank association is descriptive and cannot establish causal effects.
Player profiles
PCA provides the primary auditable low-dimensional representation, with UMAP and t-SNE used as exploratory neighborhood maps. Nonlinear embedding axes have no direct football meaning and global distances are not treated as an objective taxonomy.
K-Means, hierarchical clustering, Gaussian mixtures, DBSCAN, HDBSCAN, and spectral clustering are compared when computationally supported. The published solution uses K-Means with seven clusters. Although a DBSCAN result produced a higher silhouette, it marked 66.9% of players as noise and failed the project’s coverage and interpretability rule.
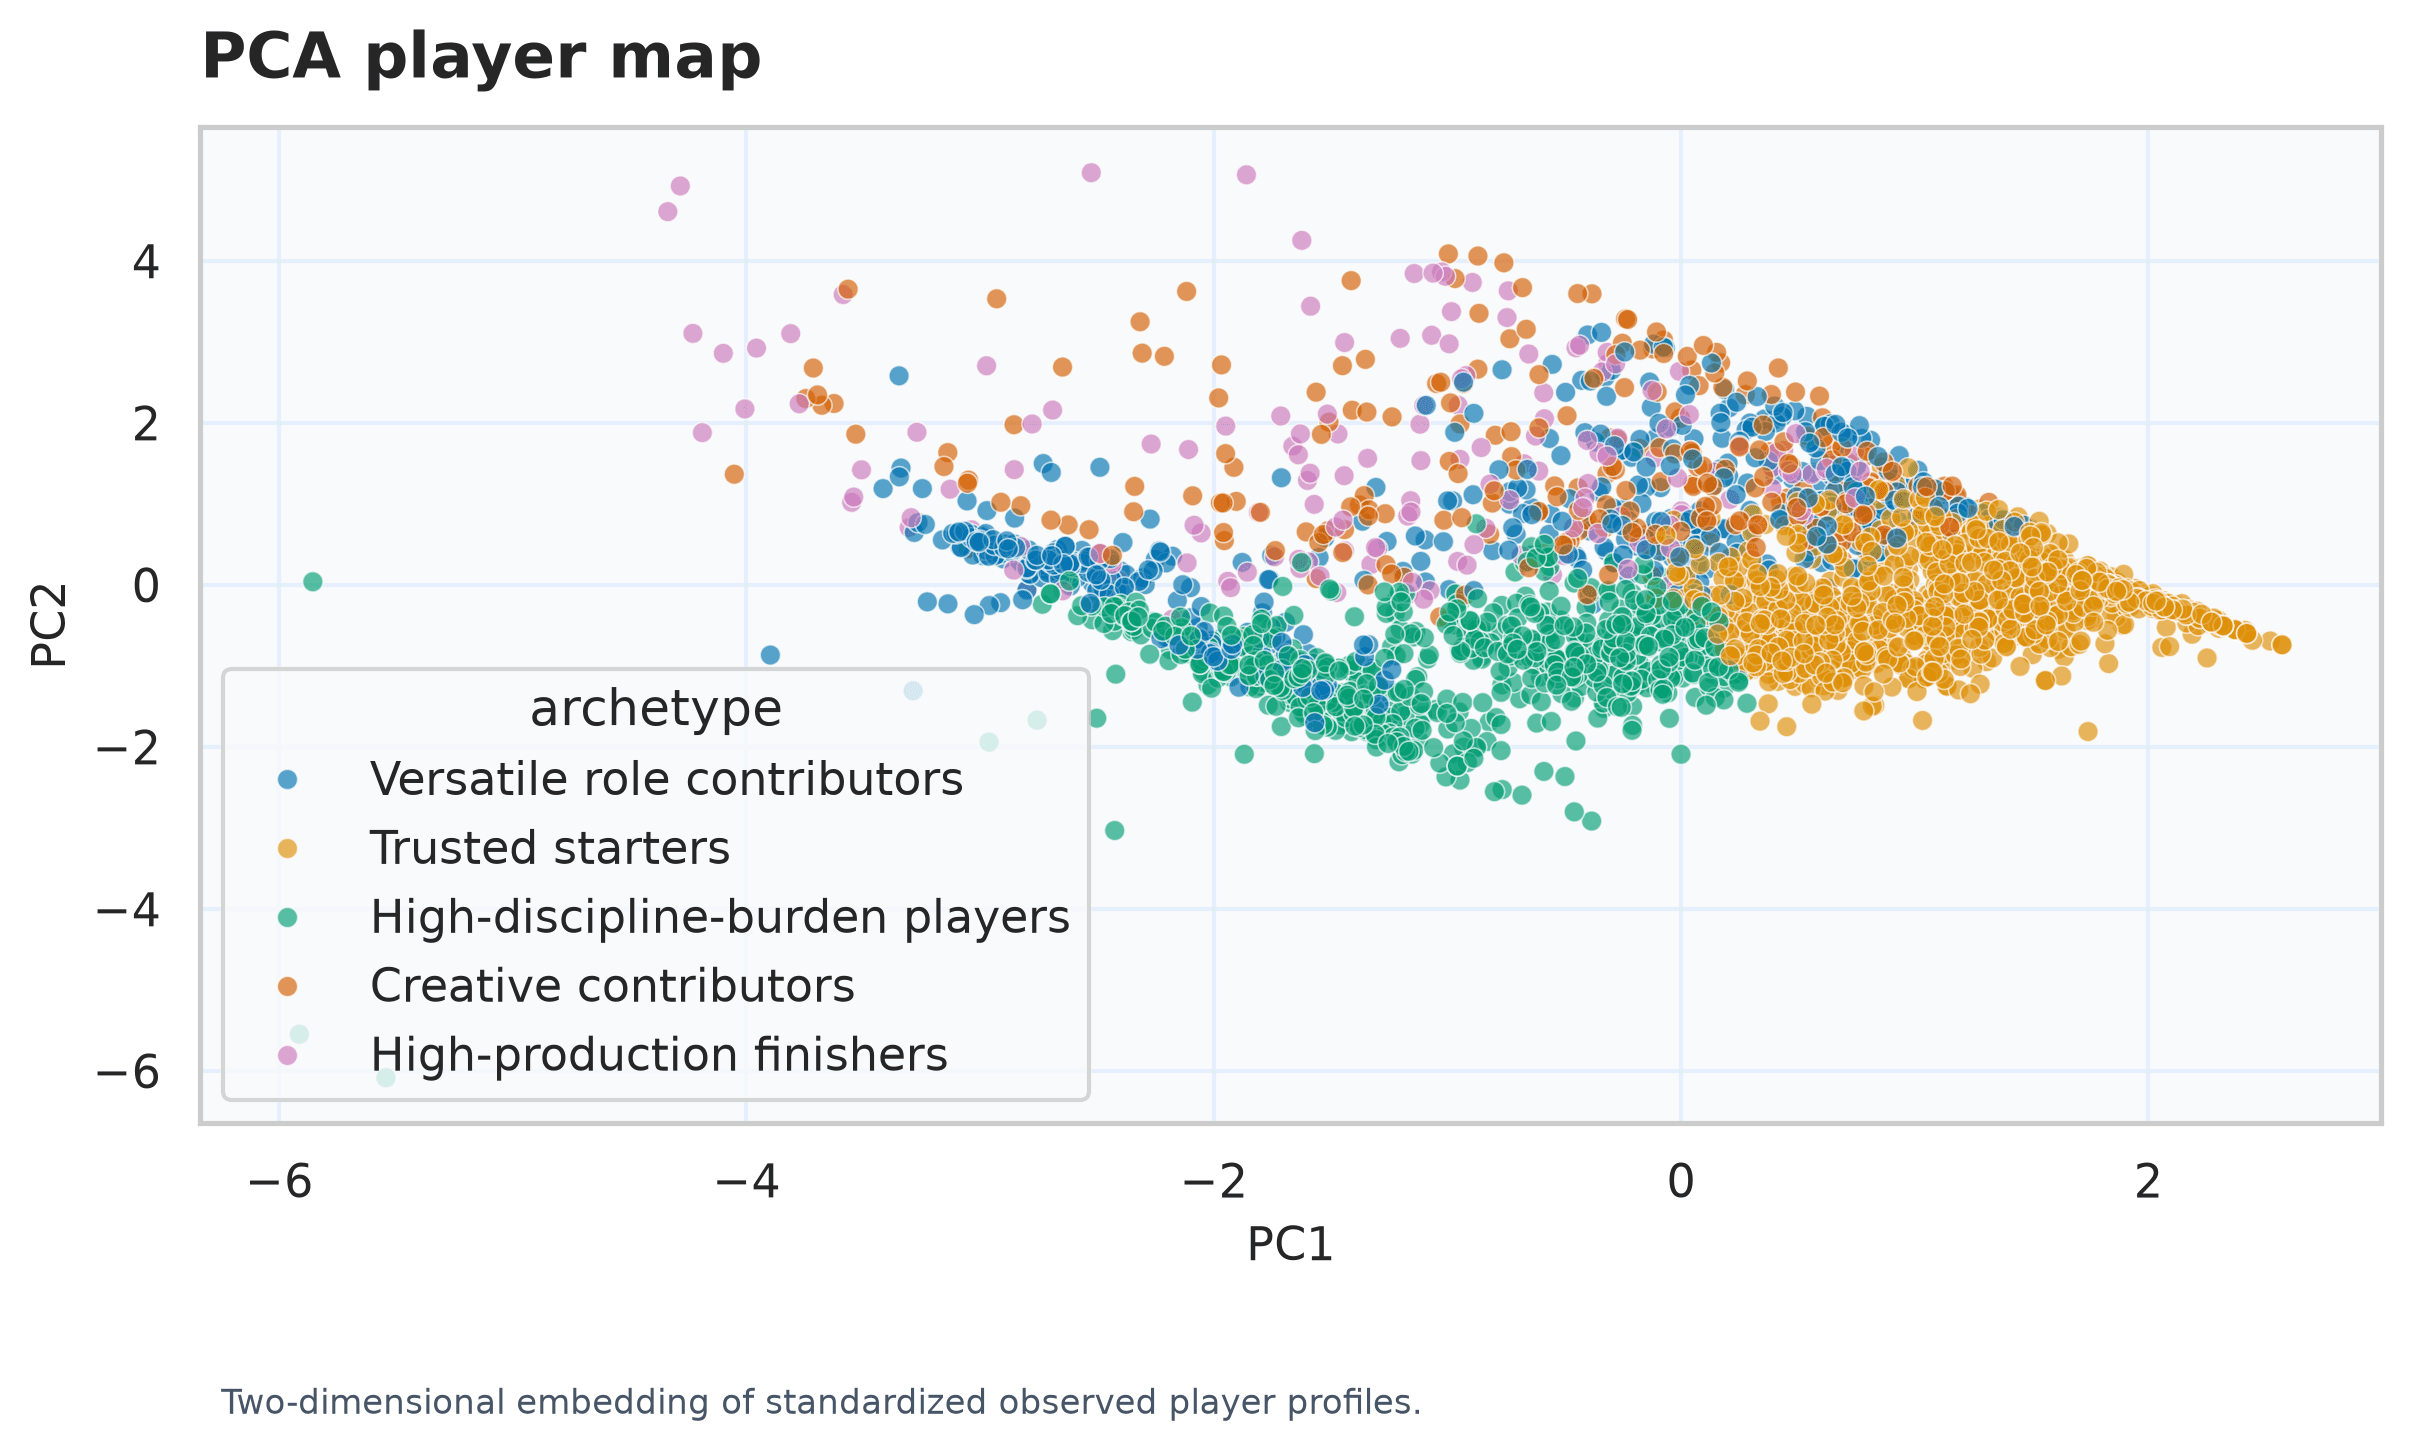
InterpretationNearby points share similar observed statistical profiles; PCA loadings make the dominant availability and production directions auditable.
LimitationStatistical proximity does not guarantee the same tactical role or playing style.
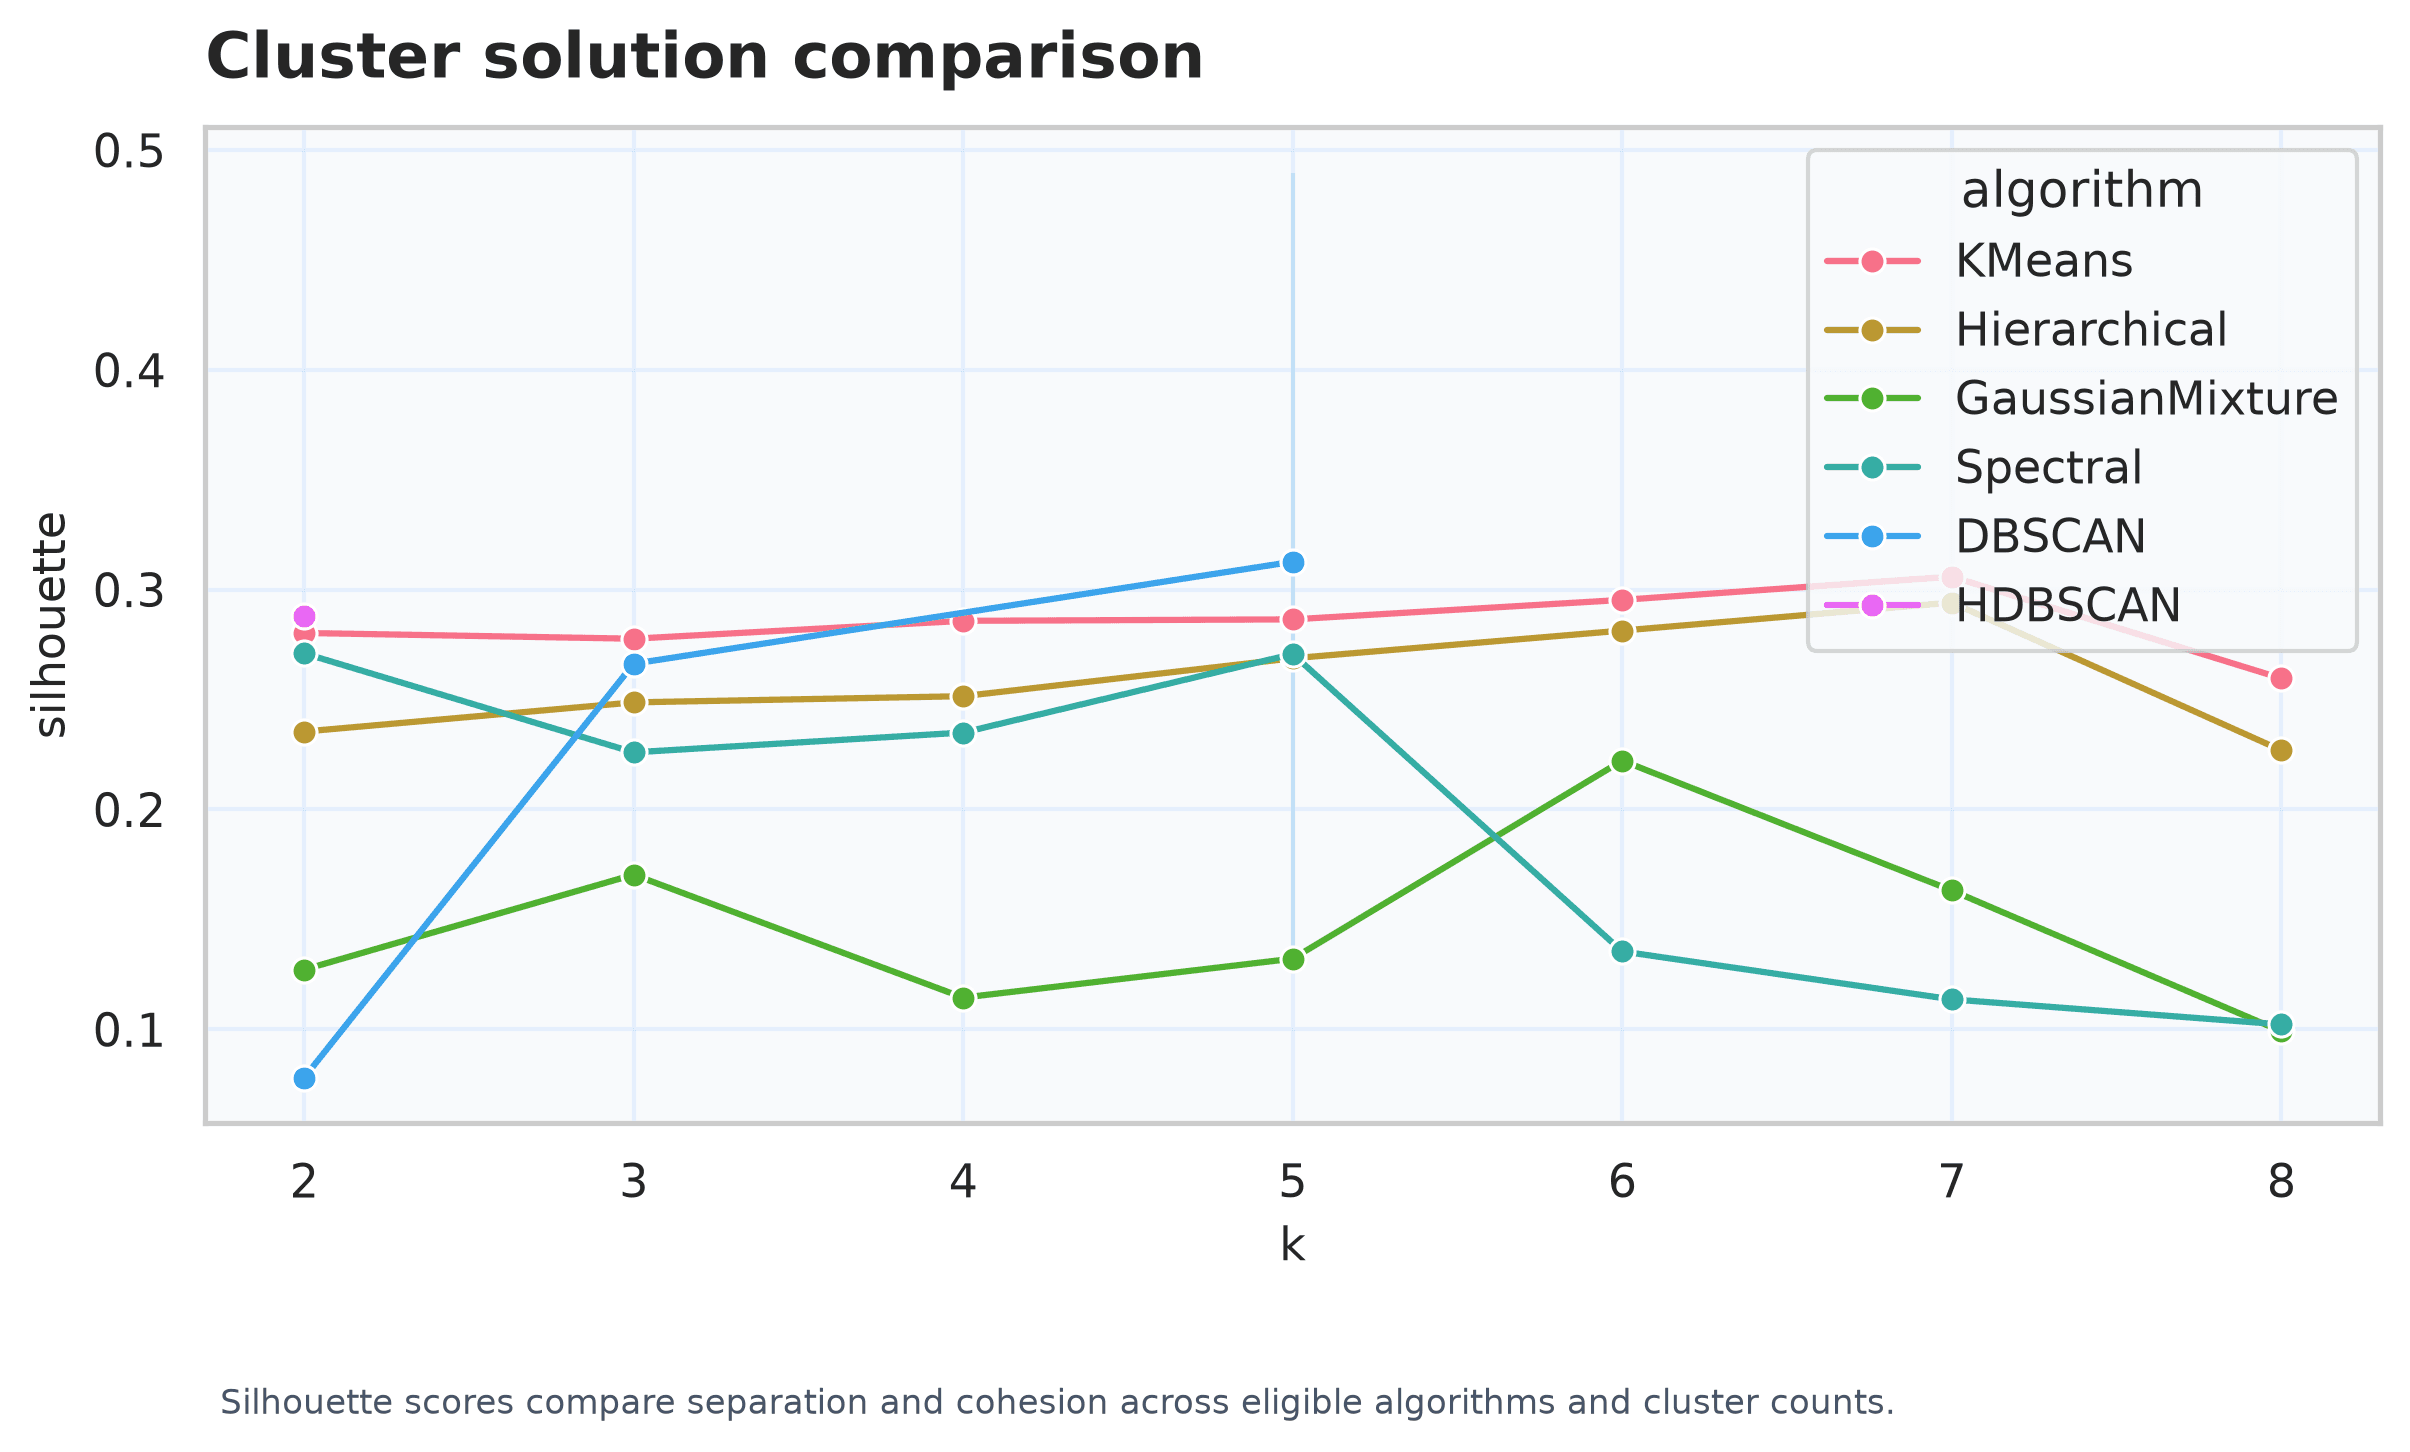
InterpretationSeparation and cohesion are considered together with stability, coverage, and whether the resulting profiles remain interpretable.
LimitationArchetype names summarize observed variables and cannot identify unrecorded defensive or possession roles.
Predictive modeling
Nine estimator families are capability-gated and tuned with Optuna inside grouped validation: linear regression, Elastic Net, random forest, gradient boosting, XGBoost, LightGBM, CatBoost, support-vector regression, and a multilayer perceptron. Preprocessing, imputation, encoding, scaling, and tuning are learned from training folds only.
The neural network best emulated the constructed cross-sectional index with nested player-disjoint RMSE 0.063, MAE 0.038, and R² 0.991. This high accuracy is mainly evidence that the estimator can recover the declared formula and interactions. It is not evidence of external or future predictive validity.
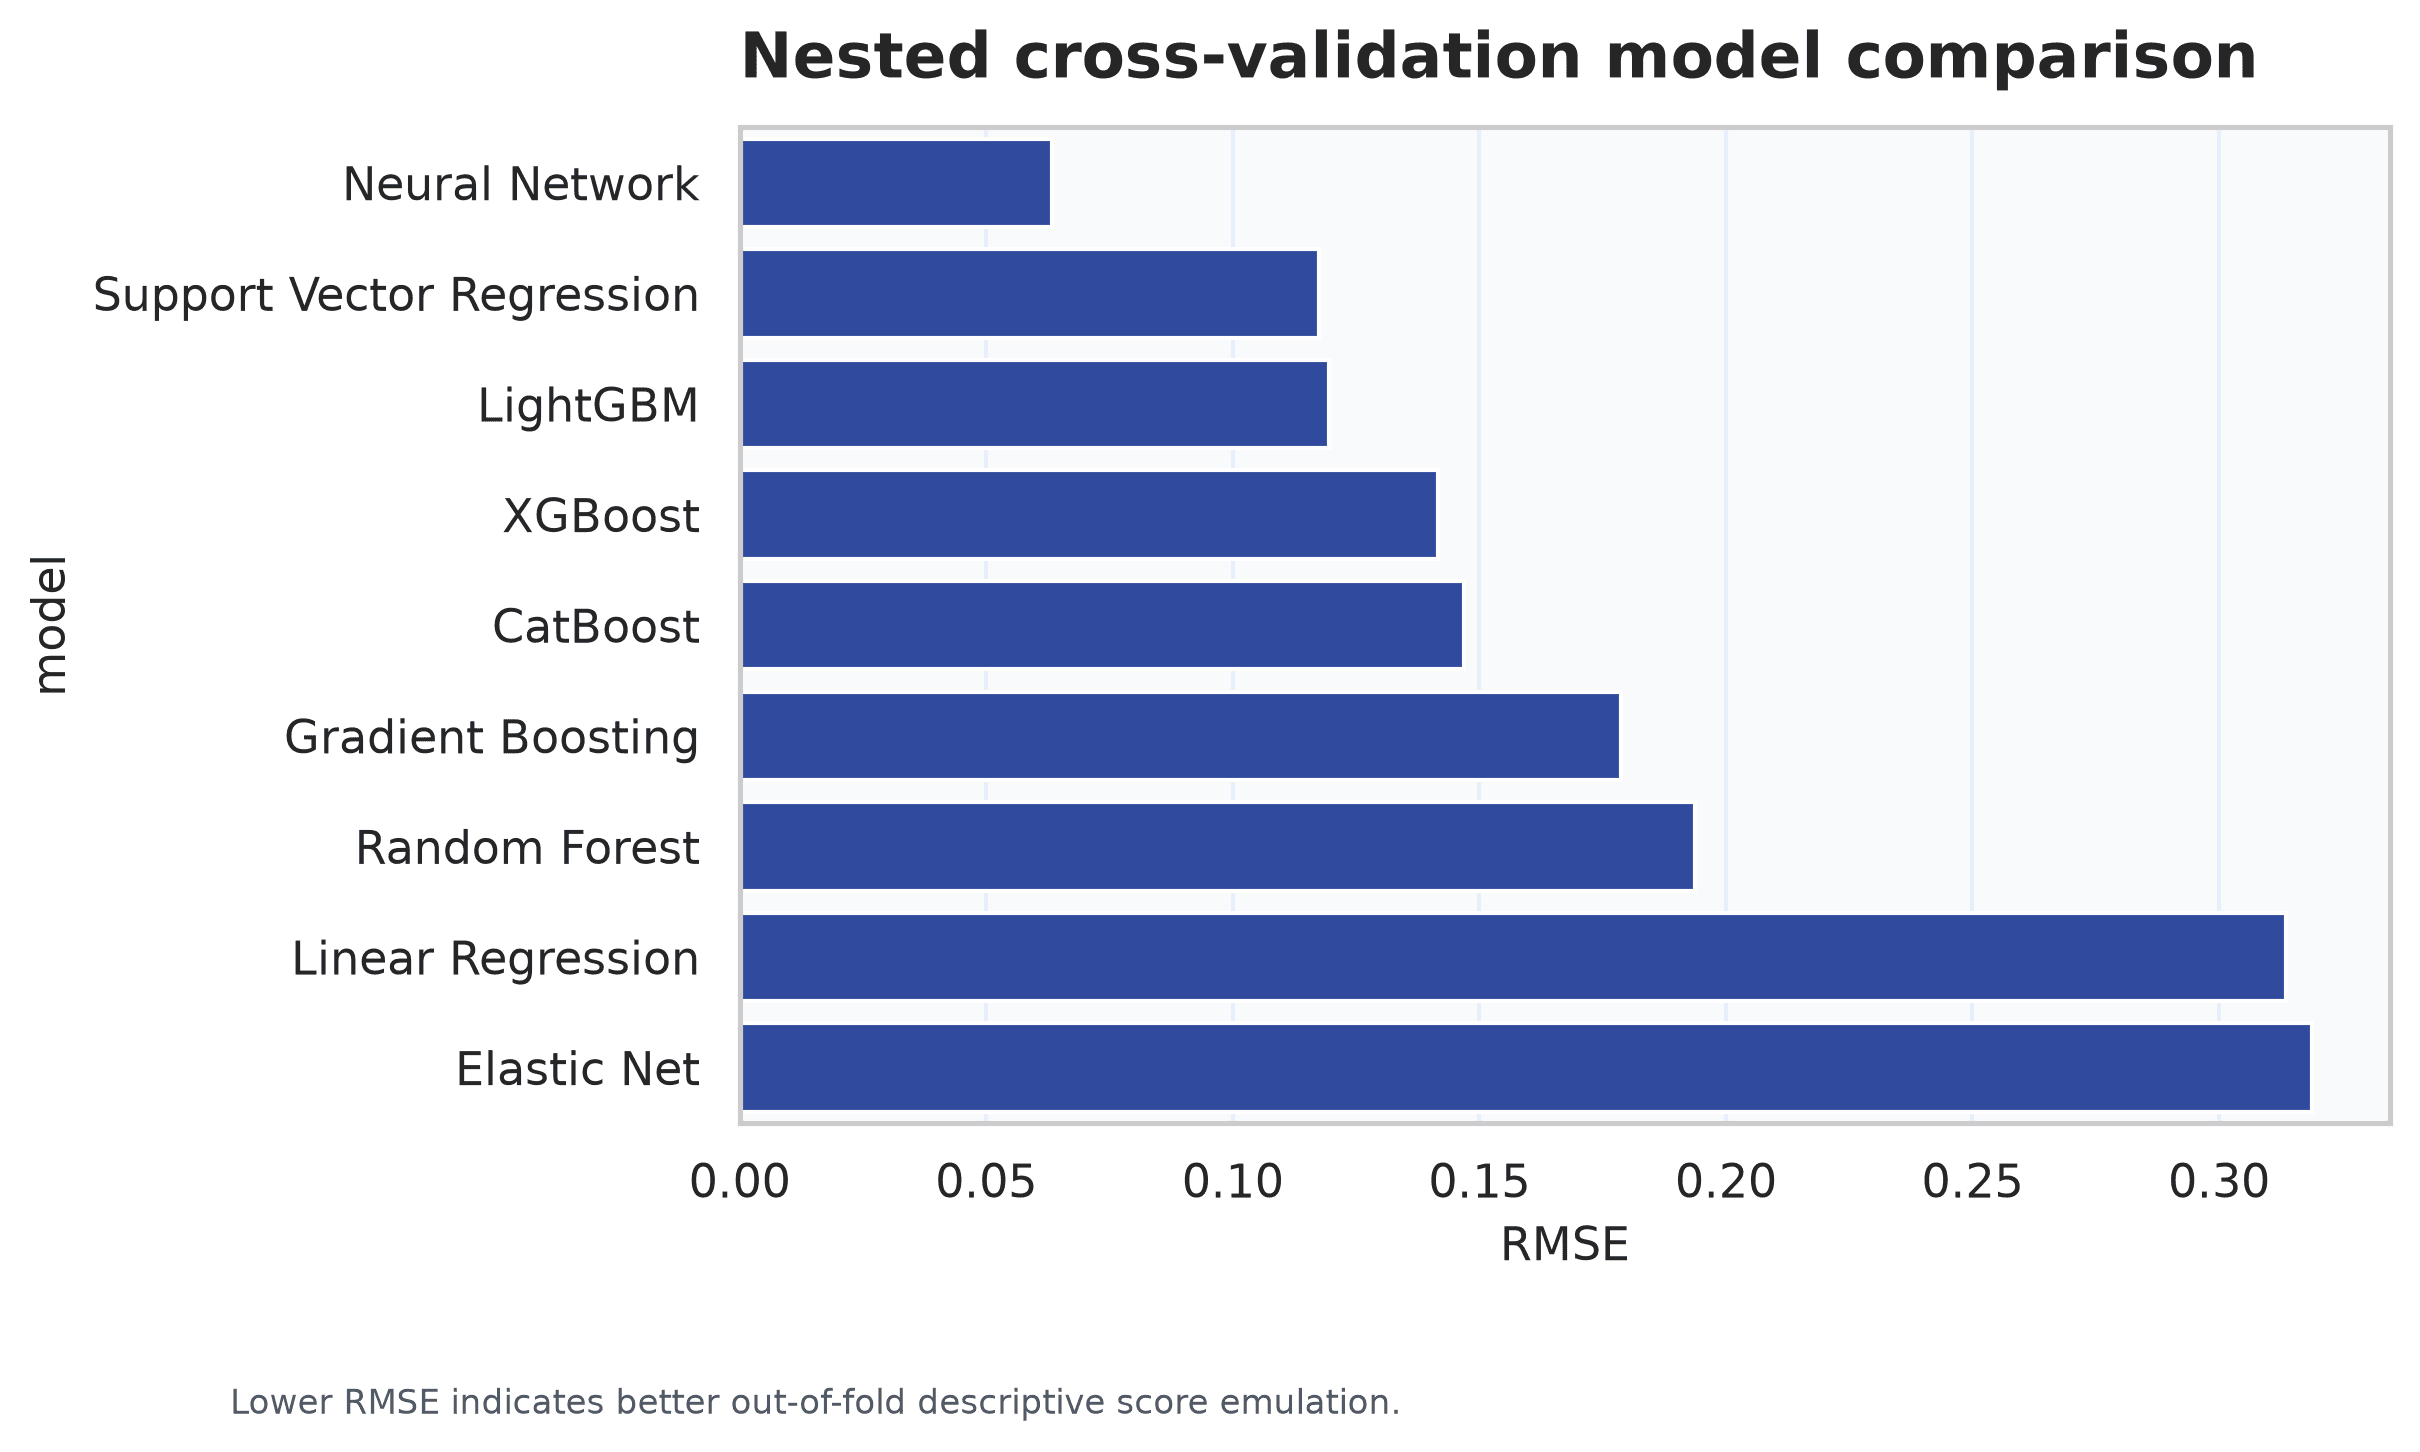
InterpretationThe neural network produced the lowest out-of-fold descriptive score-emulation error.
LimitationThe target is constructed from observed inputs, so this comparison is descriptive rather than a future-performance forecast.
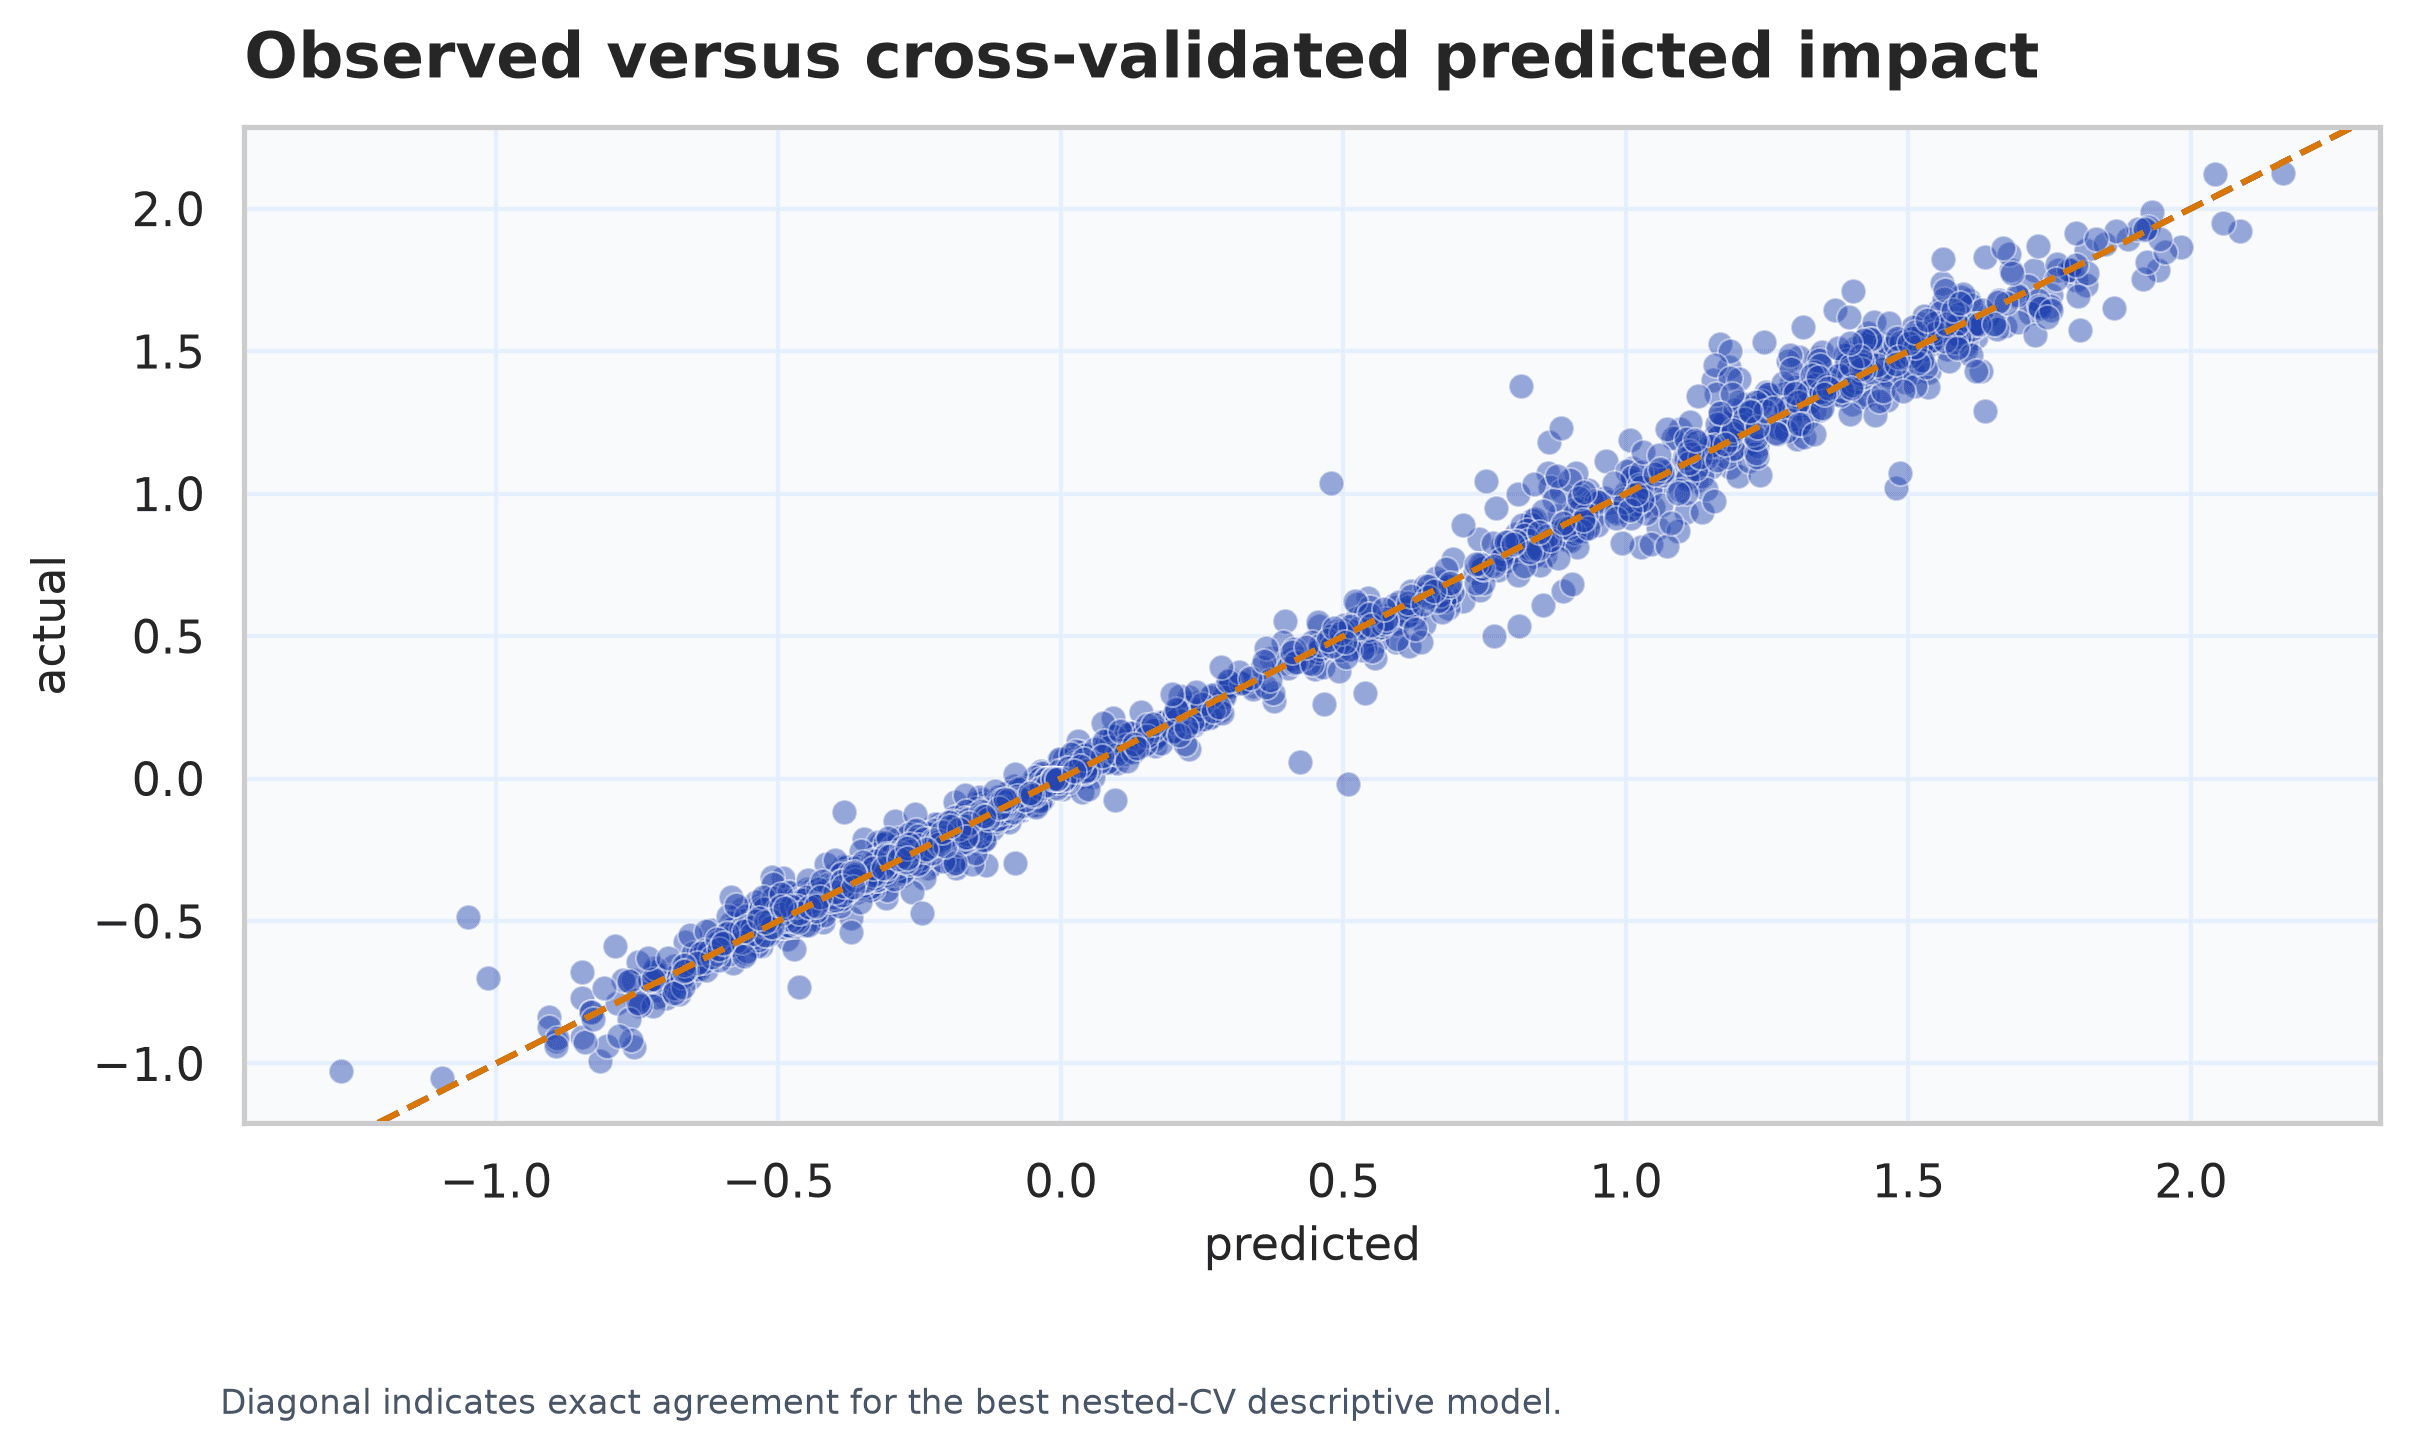
InterpretationThe tight diagonal pattern shows that the selected model recovers the declared score with limited out-of-fold error.
LimitationAgreement measures score emulation, not next-tournament performance.
The longitudinal test supplies the more meaningful prediction check. Across 423 repeat-player transitions, temporal Ridge achieved R² 0.027 and temporal random forest achieved R² 0.010. Earlier World Cup summaries therefore explained little variation in a returning player’s next observed tournament. Return itself is selective because players must remain eligible, be selected, and play for a qualified team.
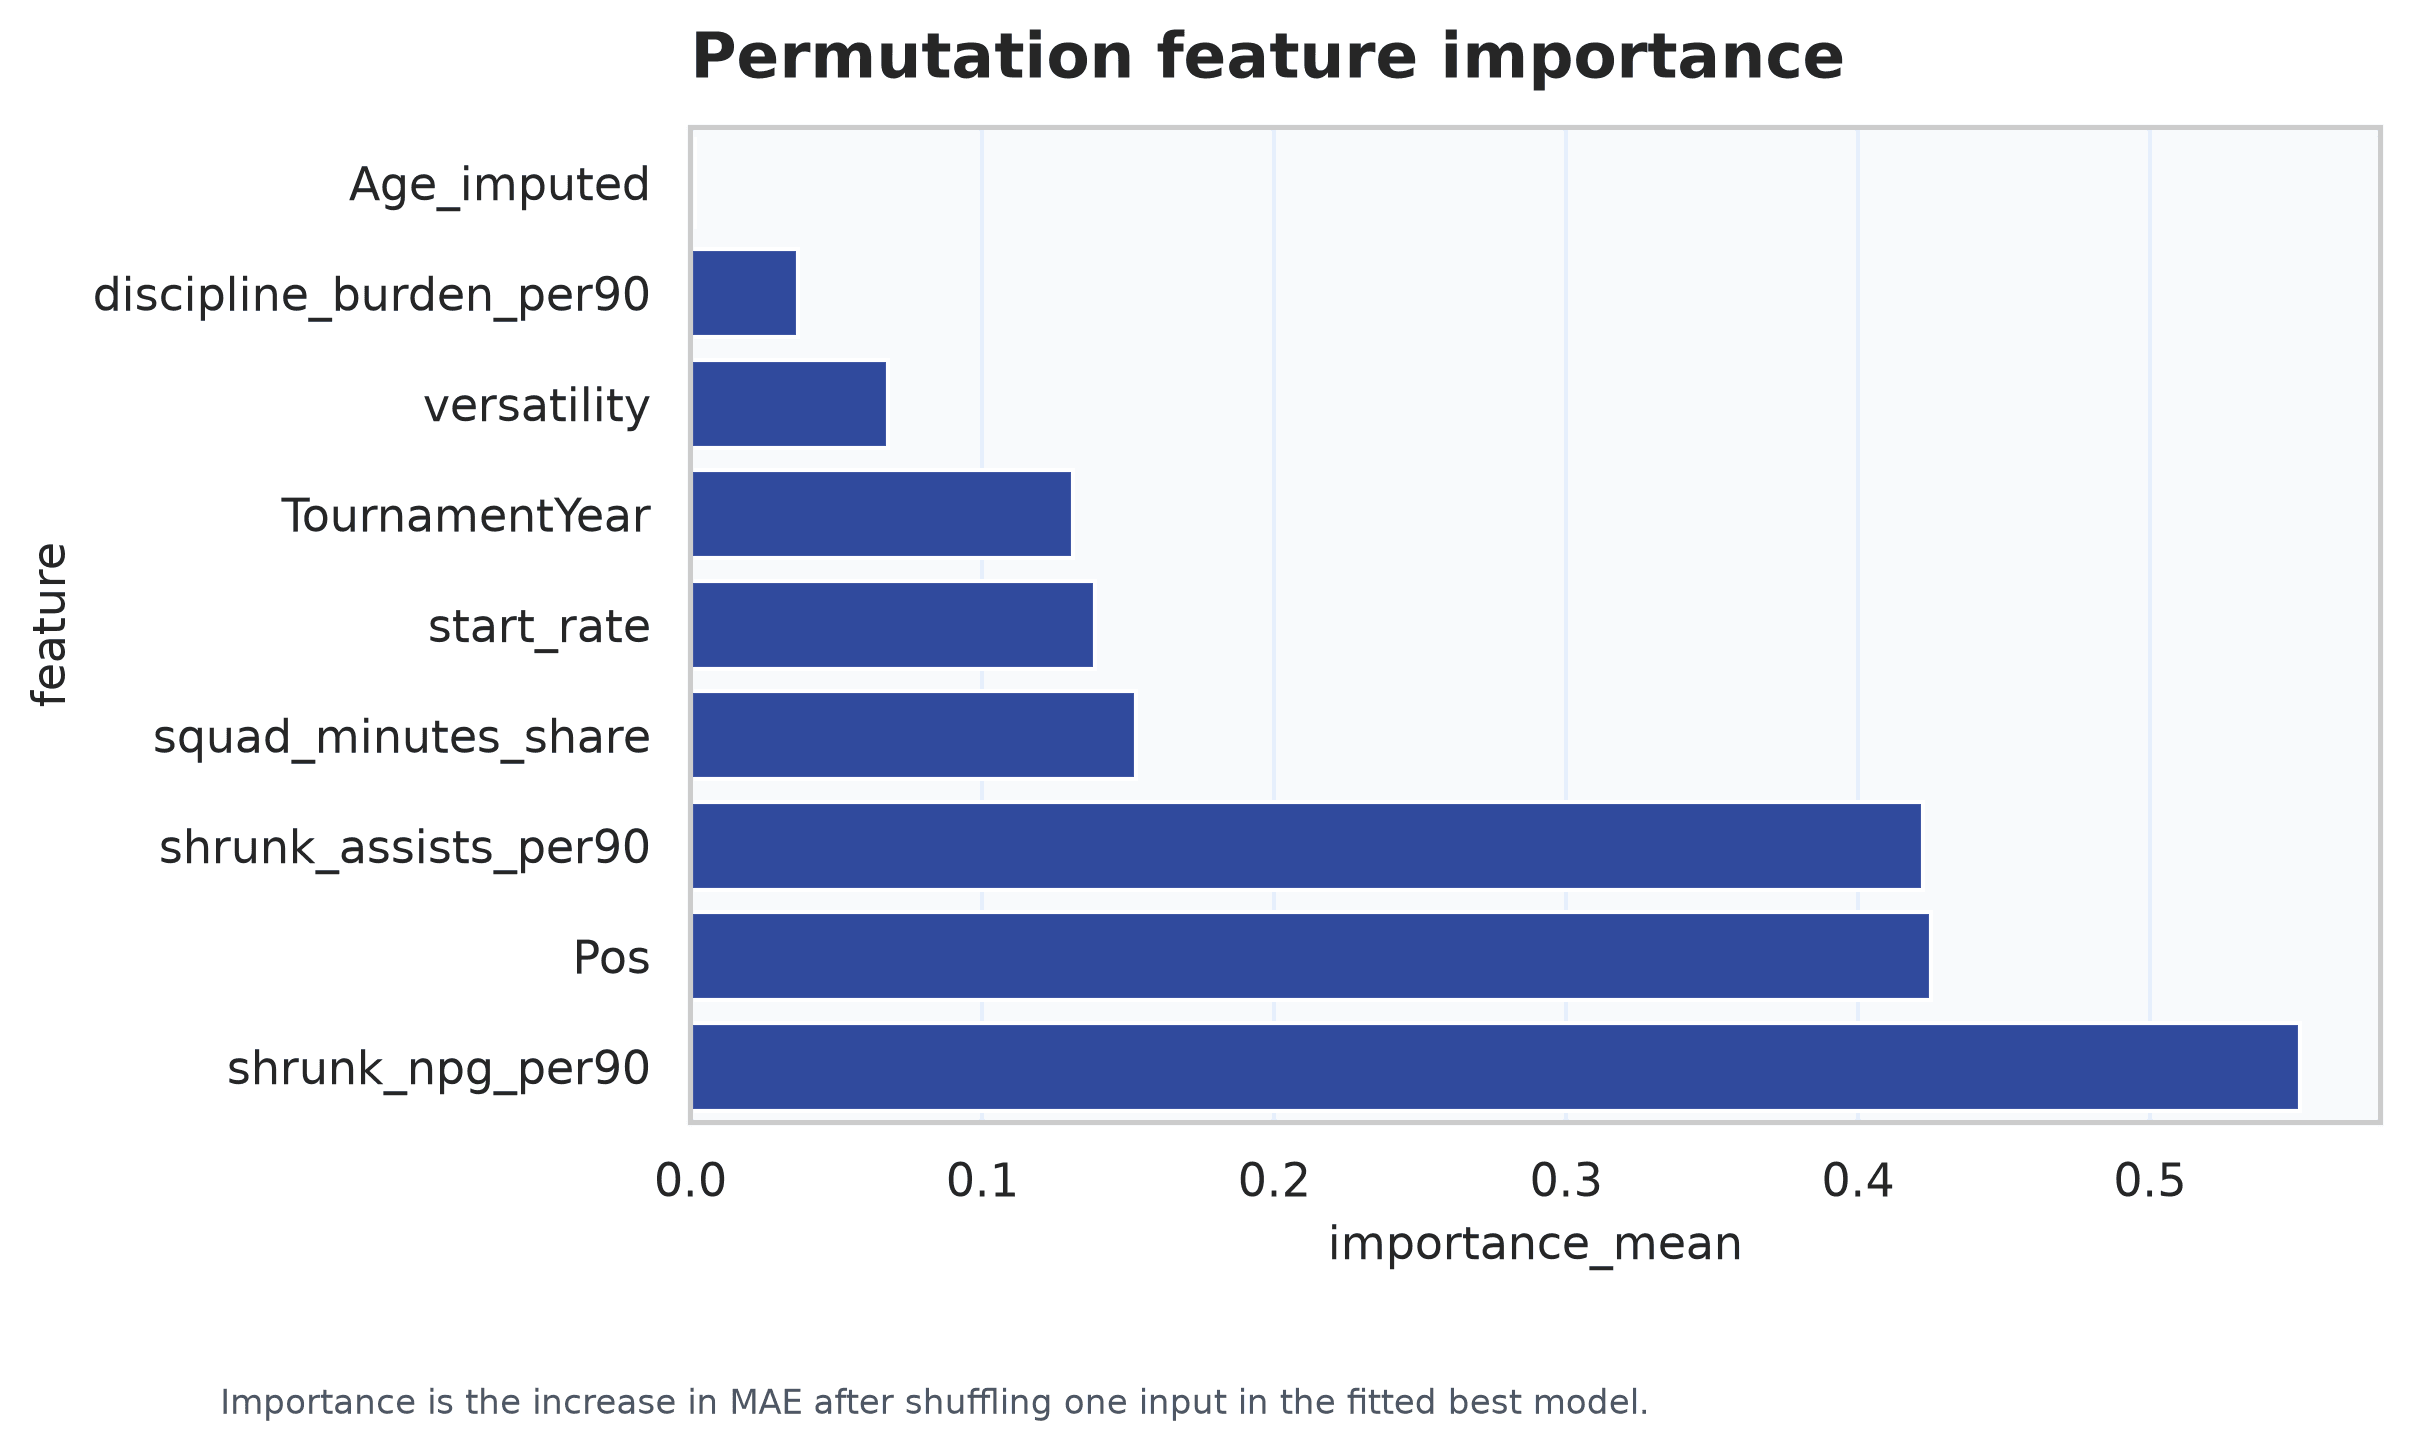
InterpretationThe chart measures how much held-out-style error increases when one fitted input is shuffled.
LimitationImportance reflects reliance inside this model and cannot recover football actions absent from the dataset.
Under-credit analysis
The under-credit estimand is the difference between observed composite impact and an out-of-fold prediction from goals, assists, minutes, broad position, tournament, and the position-adjusted production component. Positive residuals indicate broader recorded contribution beyond that benchmark.
The leading positive residuals are Ramin Rezaeian (Iran, 2026), Kwadwo Asamoah (Ghana, 2014), and Maxi Araújo (Uruguay, 2026). A negative residual does not mean that a player performed poorly; it means traditional production is high relative to the broader declared index.
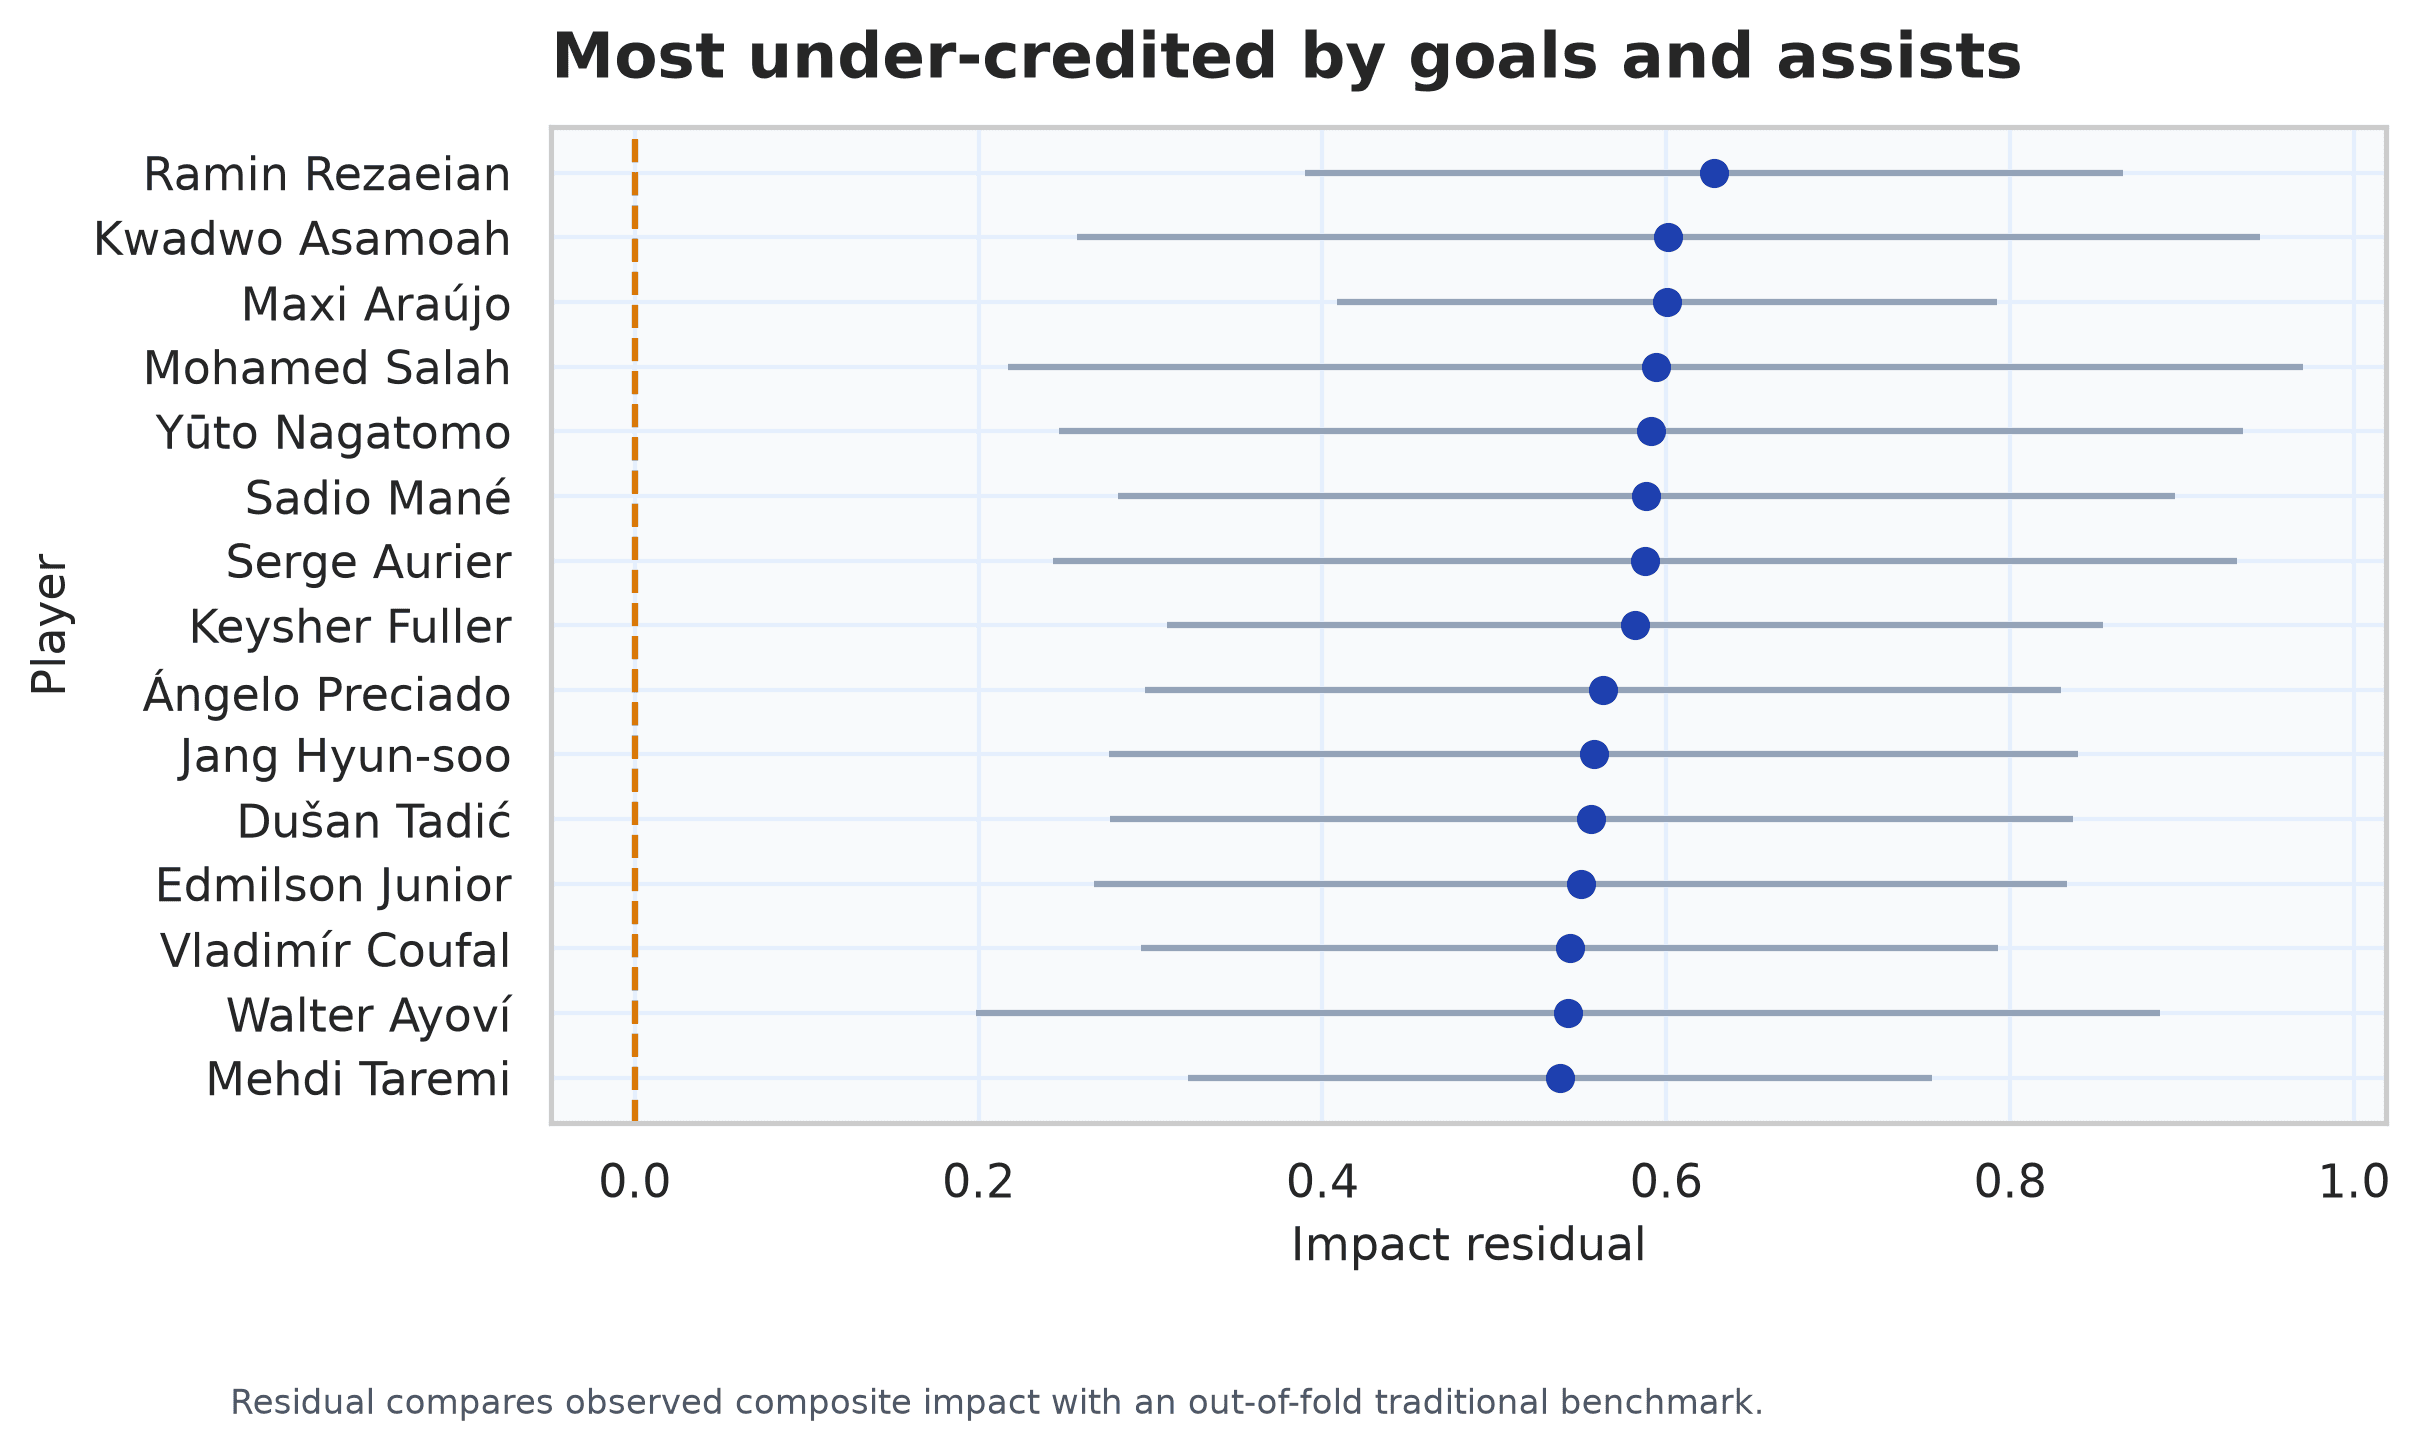
InterpretationResiduals compare the observed composite with a player-disjoint traditional-production benchmark and include exposure-sensitive intervals.
LimitationUnder-credit is statistical terminology, not a financial valuation or public-reputation claim.
Robustness
Alternative component weights emphasize production, availability, or equal dimensions. Spearman agreement with the primary ranking ranges from 0.884 to 0.928, while top-25 overlap ranges from 84% to 96%. Minute thresholds, bootstrap intervals, grouped cross-validation dispersion, and fixed-seed stability checks provide additional sensitivity evidence.
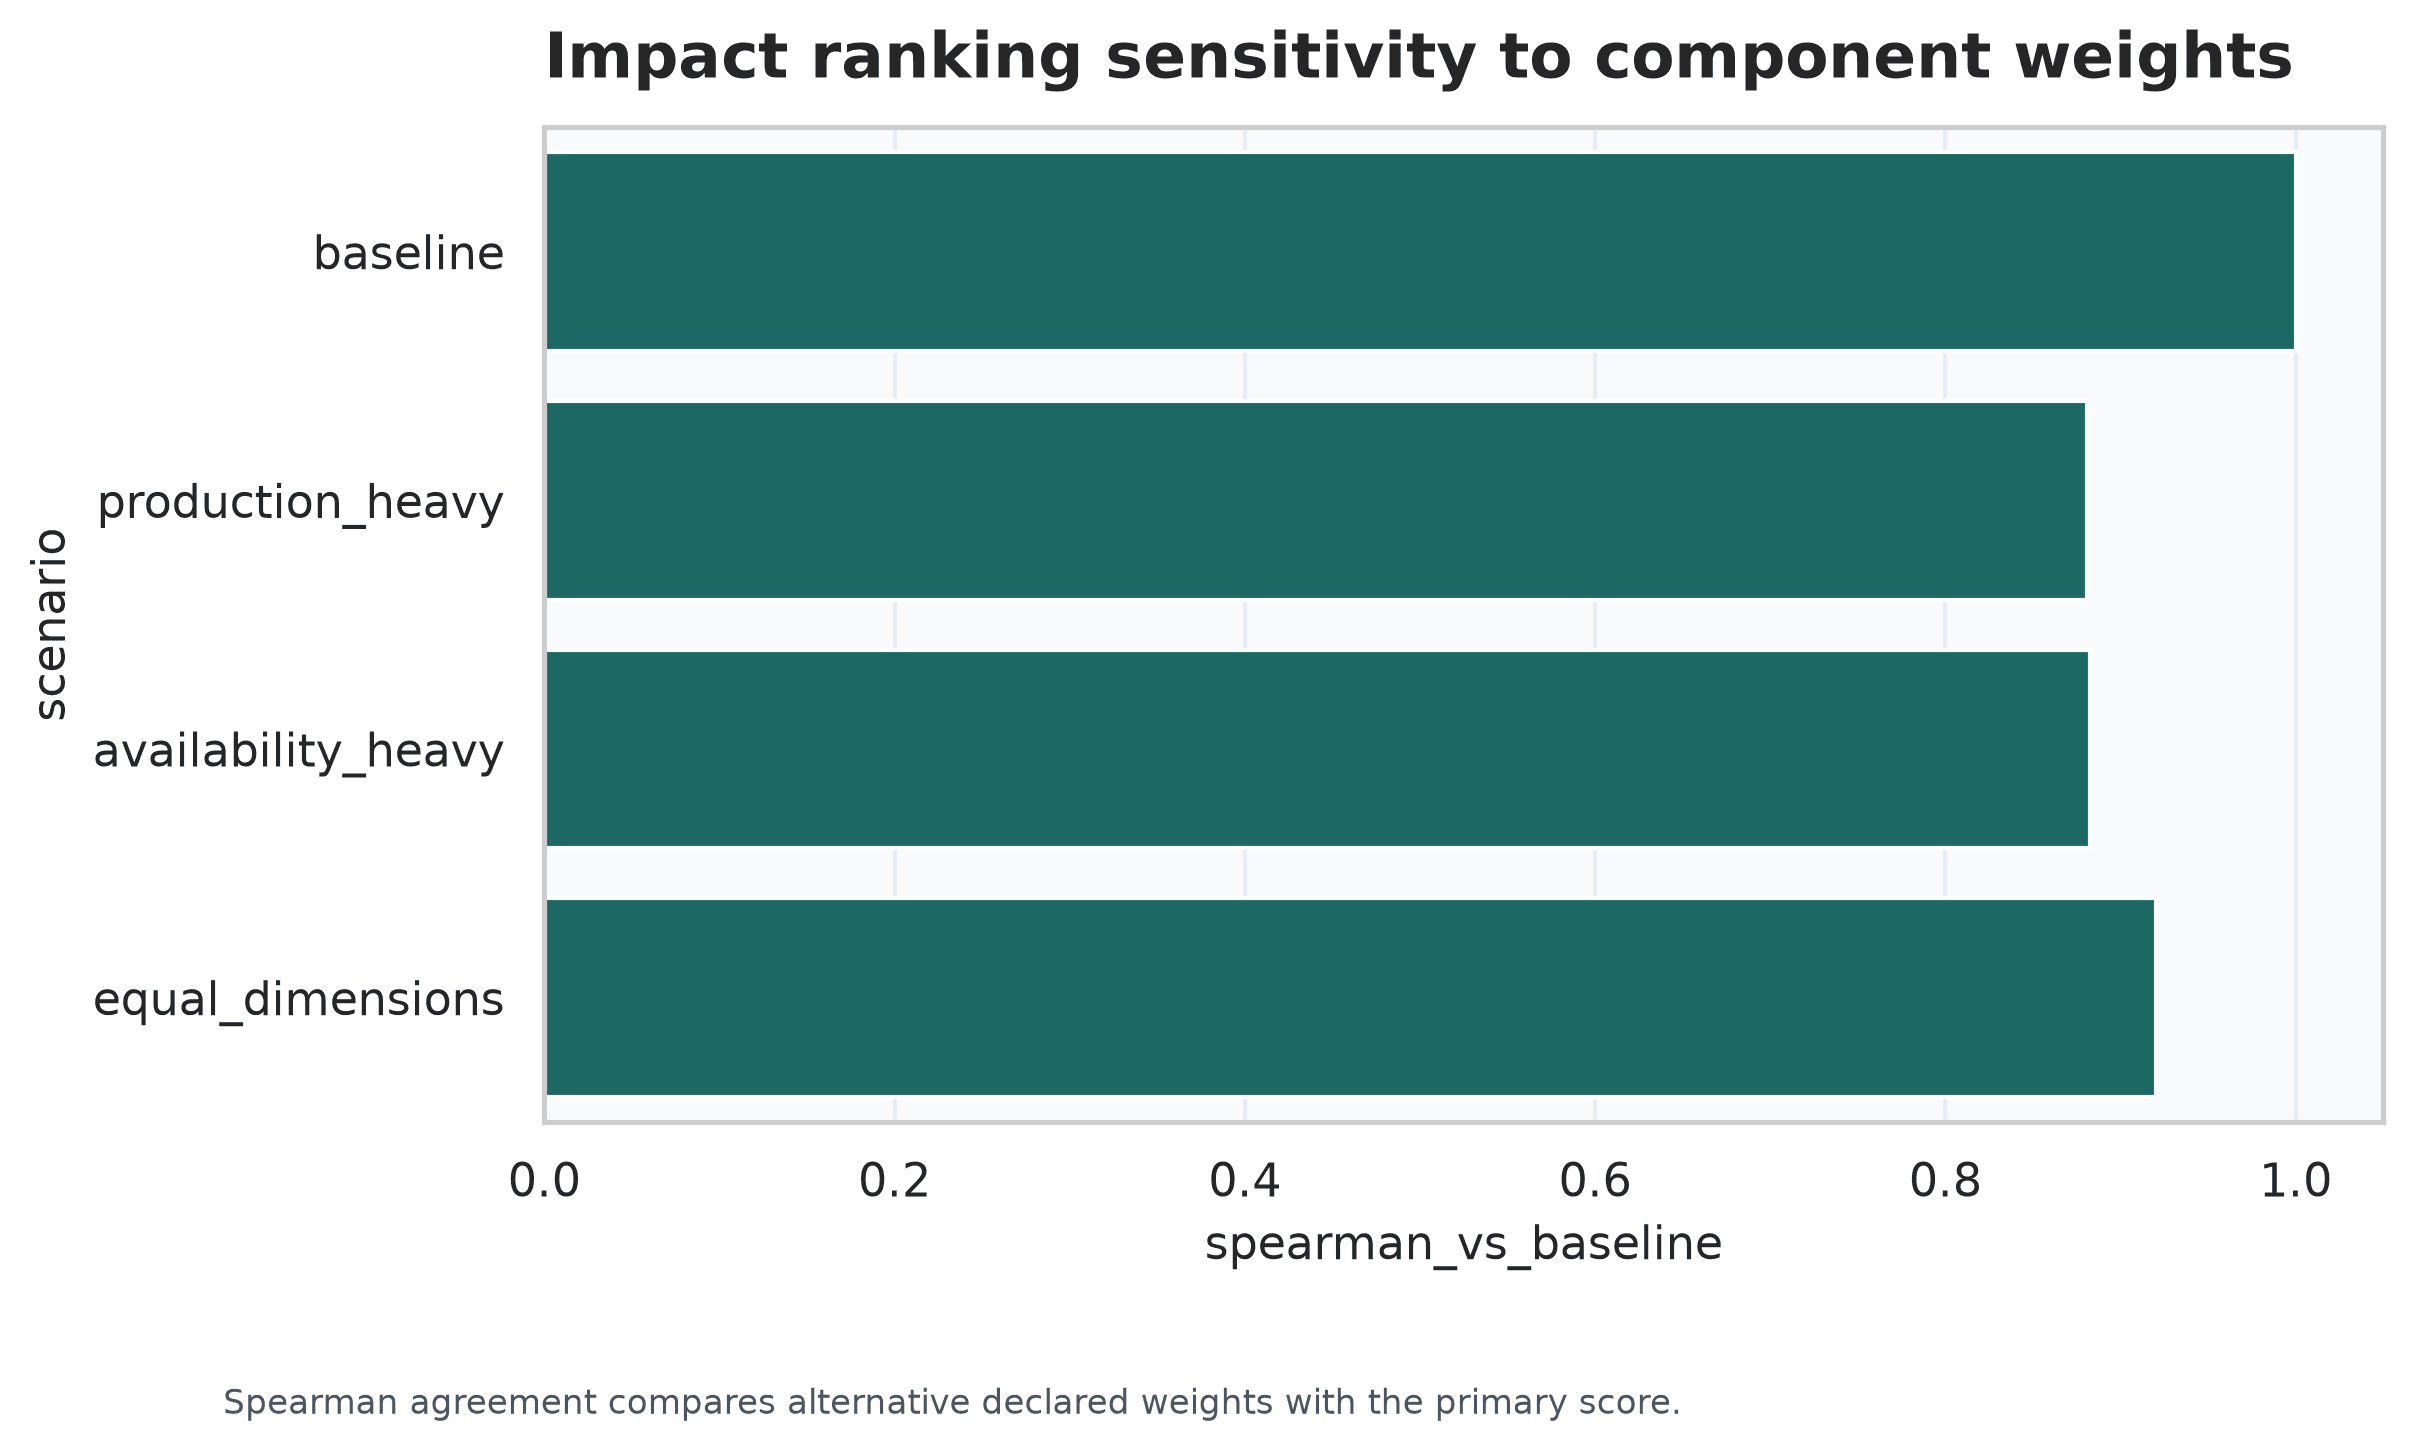
InterpretationHigh rank agreement indicates that the broad ranking pattern is not tied to one exact weight vector.
LimitationStable conclusions about a narrow index remain narrow conclusions when important actions are unmeasured.
Limitations
Future work should link event streams, lineup context, opponent strength, expected-threat or VAEP values, goalkeeper shot-stopping, injuries, and market information. A preregistered external outcome would permit a stronger predictive evaluation.
Conclusion
The observed combination that most consistently characterizes the declared index joins reliability-adjusted production with tournament availability, then adds smaller discipline and recorded-versatility terms. Role normalization, exposure adjustment, shrinkage, grouped validation, and uncertainty prevent sparse tournament totals from being presented with false precision.
The central result is methodological: professional sports analytics depends as much on measurement boundaries, leakage control, uncertainty, and careful language as it does on algorithm breadth.
References
- [1]
Decroos, T., Bransen, L., Van Haaren, J., and Davis, J. (2019). Actions Speak Louder than Goals: Valuing Player Actions in Soccer. KDD, 1851-1861. Source
- [2]
Pappalardo, L. et al. (2019). A public data set of spatio-temporal match events in soccer competitions. Scientific Data 6, 236. Source
- [3]
Lundberg, S. M. and Lee, S.-I. (2017). A Unified Approach to Interpreting Model Predictions. NeurIPS 30.
- [4]
Breiman, L. (2001). Random Forests. Machine Learning 45, 5-32.
- [5]
McInnes, L., Healy, J., and Melville, J. (2018). UMAP: Uniform Manifold Approximation and Projection for Dimension Reduction. arXiv:1802.03426. Source
Complete paper
The complete 23-page research paper is embedded below. It preserves the full methodology, statistical discussion, references, and registered figure atlas.