This study asks whether player-level offensive characteristics help explain within-player clutch efficiency preservation relative to explicit non-clutch baselines. The 2025-26 primary analysis combines robust inference and repeated cross-validation with bootstrap uncertainty, component empirical-Bayes shrinkage, player-specific simulation, and multi-season stability checks. The results describe associations and predictive performance; they do not establish a psychological clutch trait.
Raw late-game percentages mix baseline skill, opportunity, role, and severe sampling variation. This publication therefore keeps three questions separate: who improved or declined in the observed season, whether normal-condition features predict that change, and how much apparent separation remains after uncertainty adjustment. The central result is restrained: shot diversity and playmaking contained weak adjusted signals; held-out R² remained negative despite a slight RMSE improvement over the mean model (Random Forest RMSE 8.78 versus mean model 9.05); shrinkage cut the raw spread by more than half; and year-to-year persistence was low.
Primary sample
99 players2025-26 regular seasonMean ΔTS
−2.29 pp95% CI −4.06 to −0.54Shrinkage
52.5%Cross-player SD contractionBest CV R²
−0.075Random Forest, repeated CVWhich player-level offensive characteristics best predict the preservation or improvement of scoring efficiency during NBA clutch situations relative to explicitly non-clutch conditions?
The estimand is efficiency change within a player, not a ranking of absolute late-game efficiency. Descriptive improvement, out-of-sample prediction, and uncertainty-adjusted evidence answer different questions and are reported separately.
Data and sample
Dataset summary
NBA player season and clutch statistics, 2022-23 through 2025-26
- Observations
- 99 players in the 2025-26 primary sample
- Features
- 8 theory-selected primary predictors
- Target
- Clutch TS minus explicitly non-clutch TS
- Source
- Cached NBA Stats responses collected through nba_api 1.11.4
The primary screen required at least 500 regular-season minutes, 100 total field-goal attempts, and 25 standard-clutch field-goal attempts. Equivalent core tables from 2022-23, 2023-24, and 2024-25 form the validation panel; the cross-sectional primary models use 2025-26 rather than treating repeated player-seasons as independent.
The league-wide full-season shot-event response stopped at an exact 102,400-row cap and was excluded as a complete source. Complete season zone totals instead come from league shot-location data. The 7,104 standard-clutch shot events reconcile exactly to the sample's clutch field-goal attempts. Successful responses, parameters, schemas, and timestamps were cached so the finished analysis can be regenerated without live collection.
Measurement
Standard clutch follows the NBA Stats definition: the final five minutes of the fourth quarter or overtime with the score within five points. Non-clutch points, field goals, free throws, assists, and turnovers are calculated as season totals minus standard-clutch counts before rates are formed.
ΔTS = TS_clutch − TS_nonclutch
Delta TS measures preservation or improvement relative to the same player's explicitly non-clutch offense. It is not absolute efficiency: a strong scorer can remain efficient while declining, and a less efficient scorer can improve from a lower baseline. It also cannot isolate psychology from shot difficulty, tactics, defensive attention, role, or chance.
The eight theory-selected primary predictors are non-clutch baseline TS, free-throw rate, three-point rate, normalized shot entropy, the Self-Creation Index, assists per 36 minutes, turnover rate, and clutch FGA. Usage was omitted from the primary model because its variance-inflation factor exceeded 8; it remains in explicitly labeled sensitivity models.
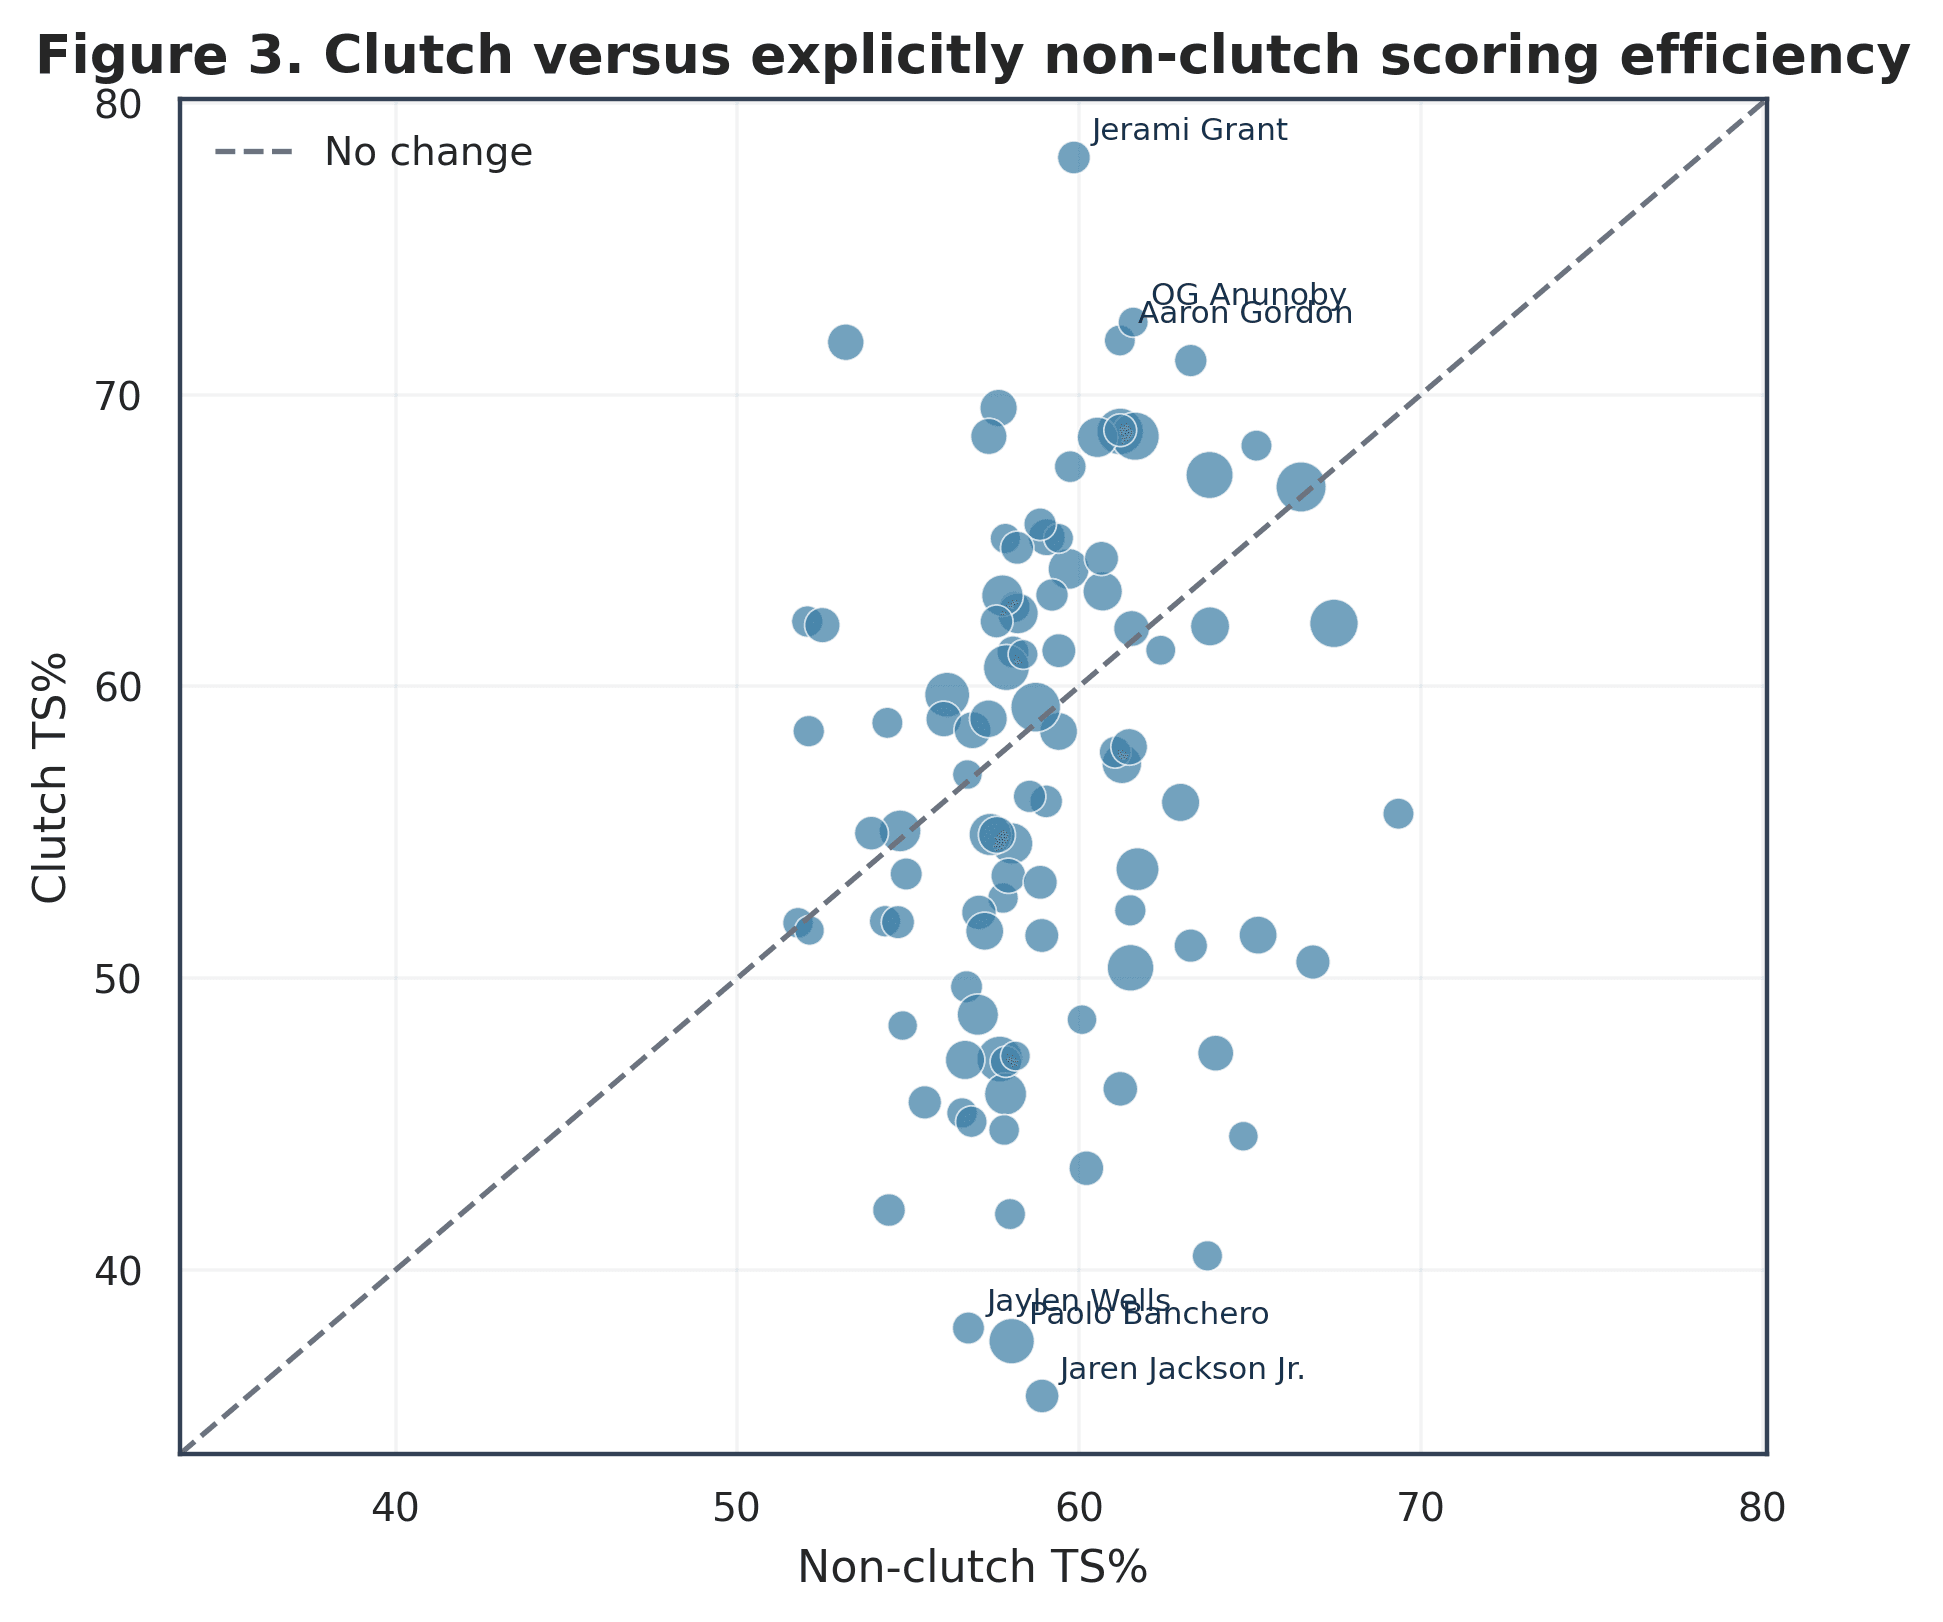
InterpretationPlayers above the identity line improved and those below declined, while the vertical spread shows that absolute clutch efficiency and within-player change are distinct quantities.
LimitationThe points describe one selected regular-season sample and do not identify why a player's efficiency changed.
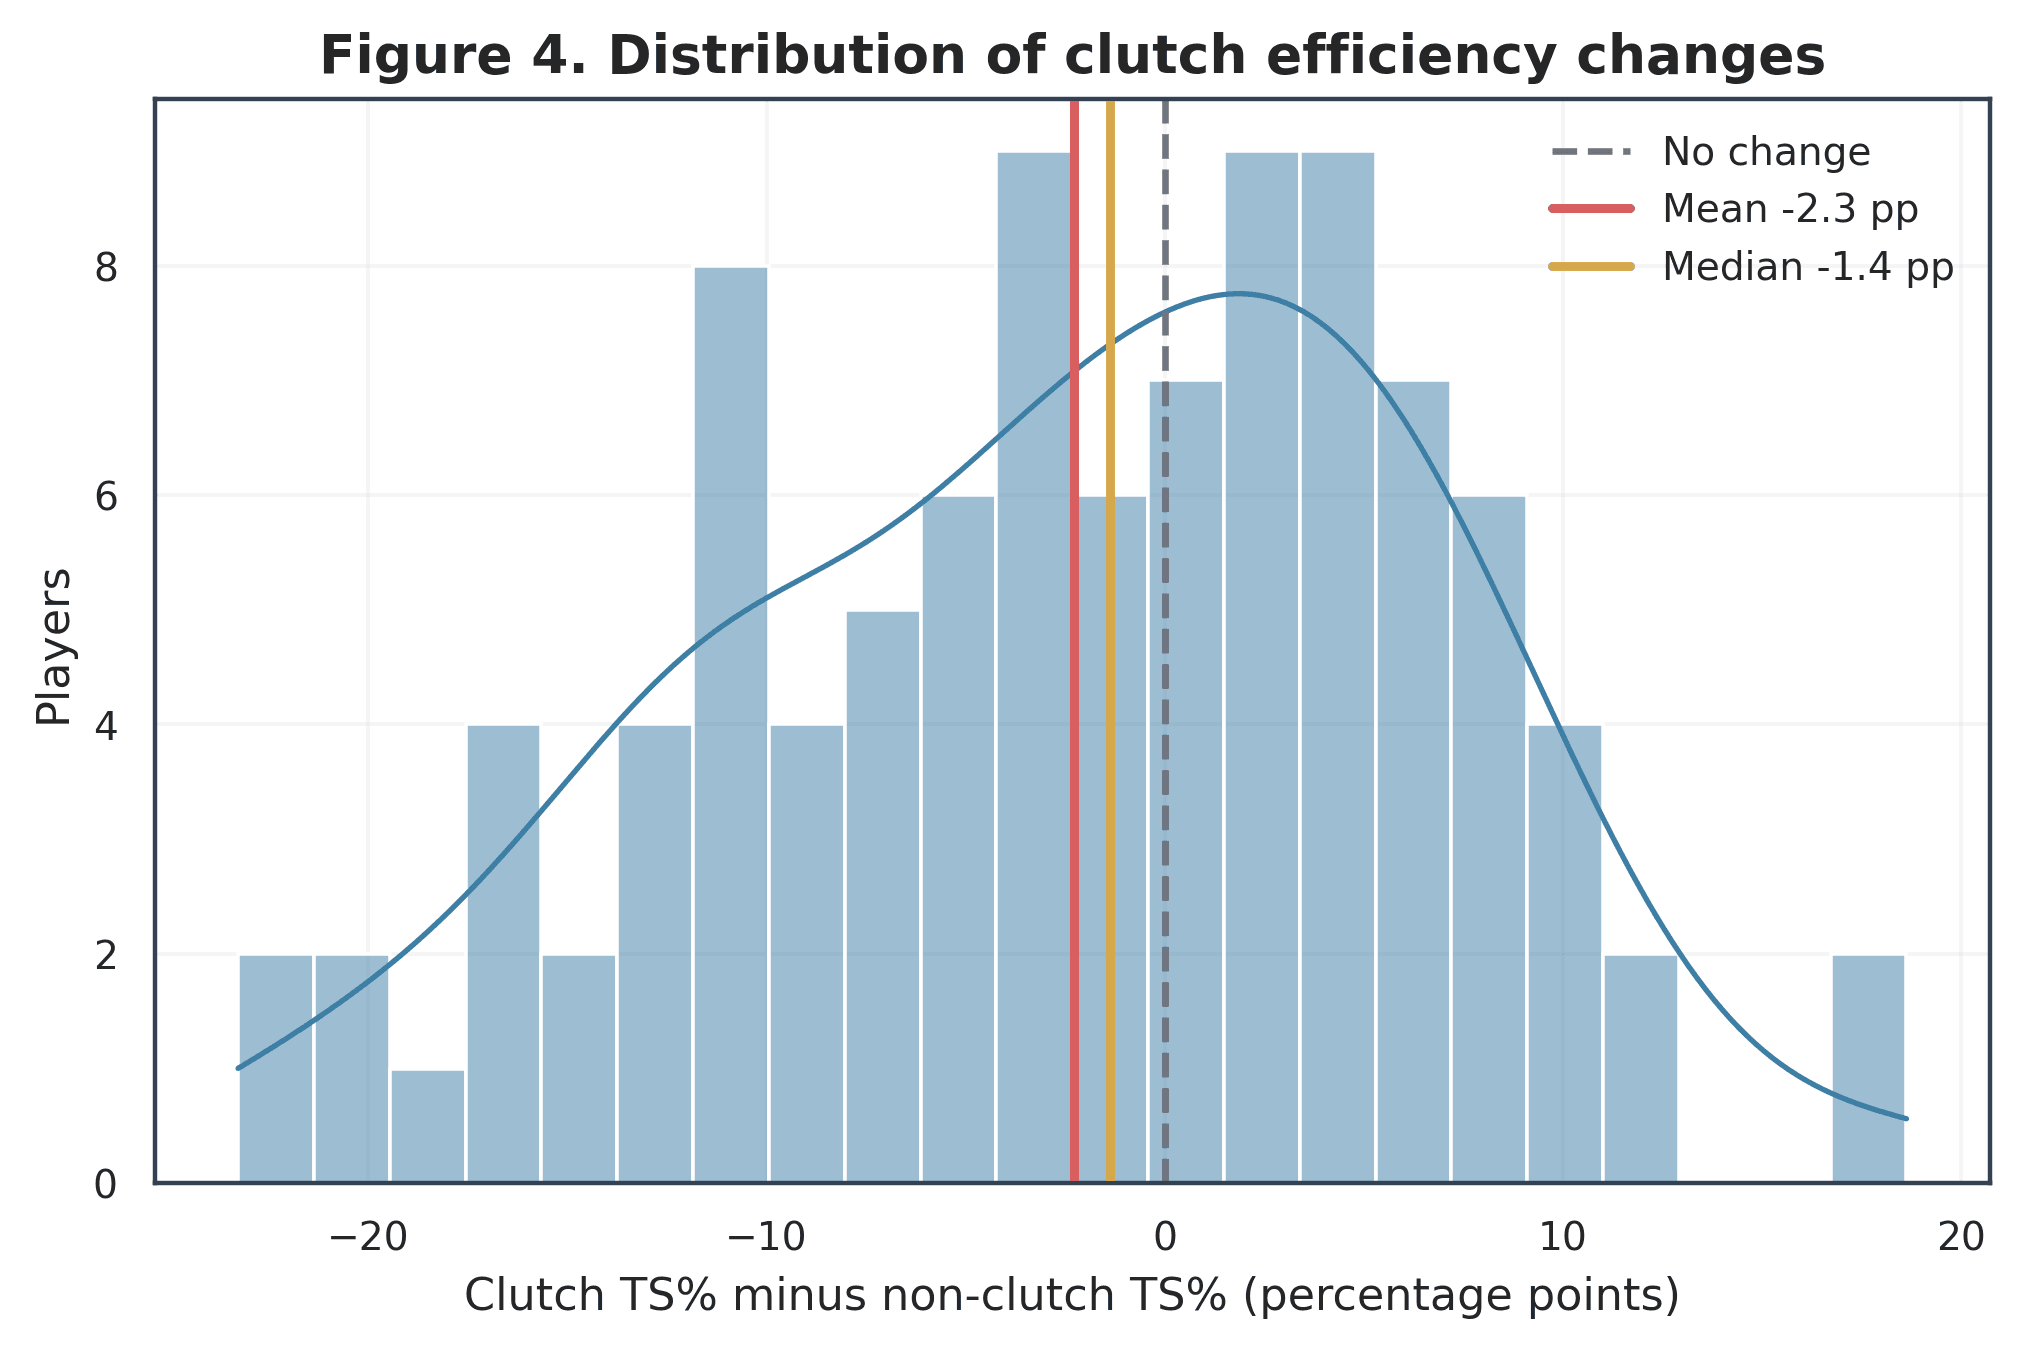
InterpretationThe distribution is broad relative to its modestly negative center: mean ΔTS was −2.29 percentage points, bootstrap 95% CI −4.06 to −0.54, and median −1.37.
LimitationObserved tails beyond 15 percentage points are valid season descriptions but require uncertainty analysis before they are treated as stable differences.
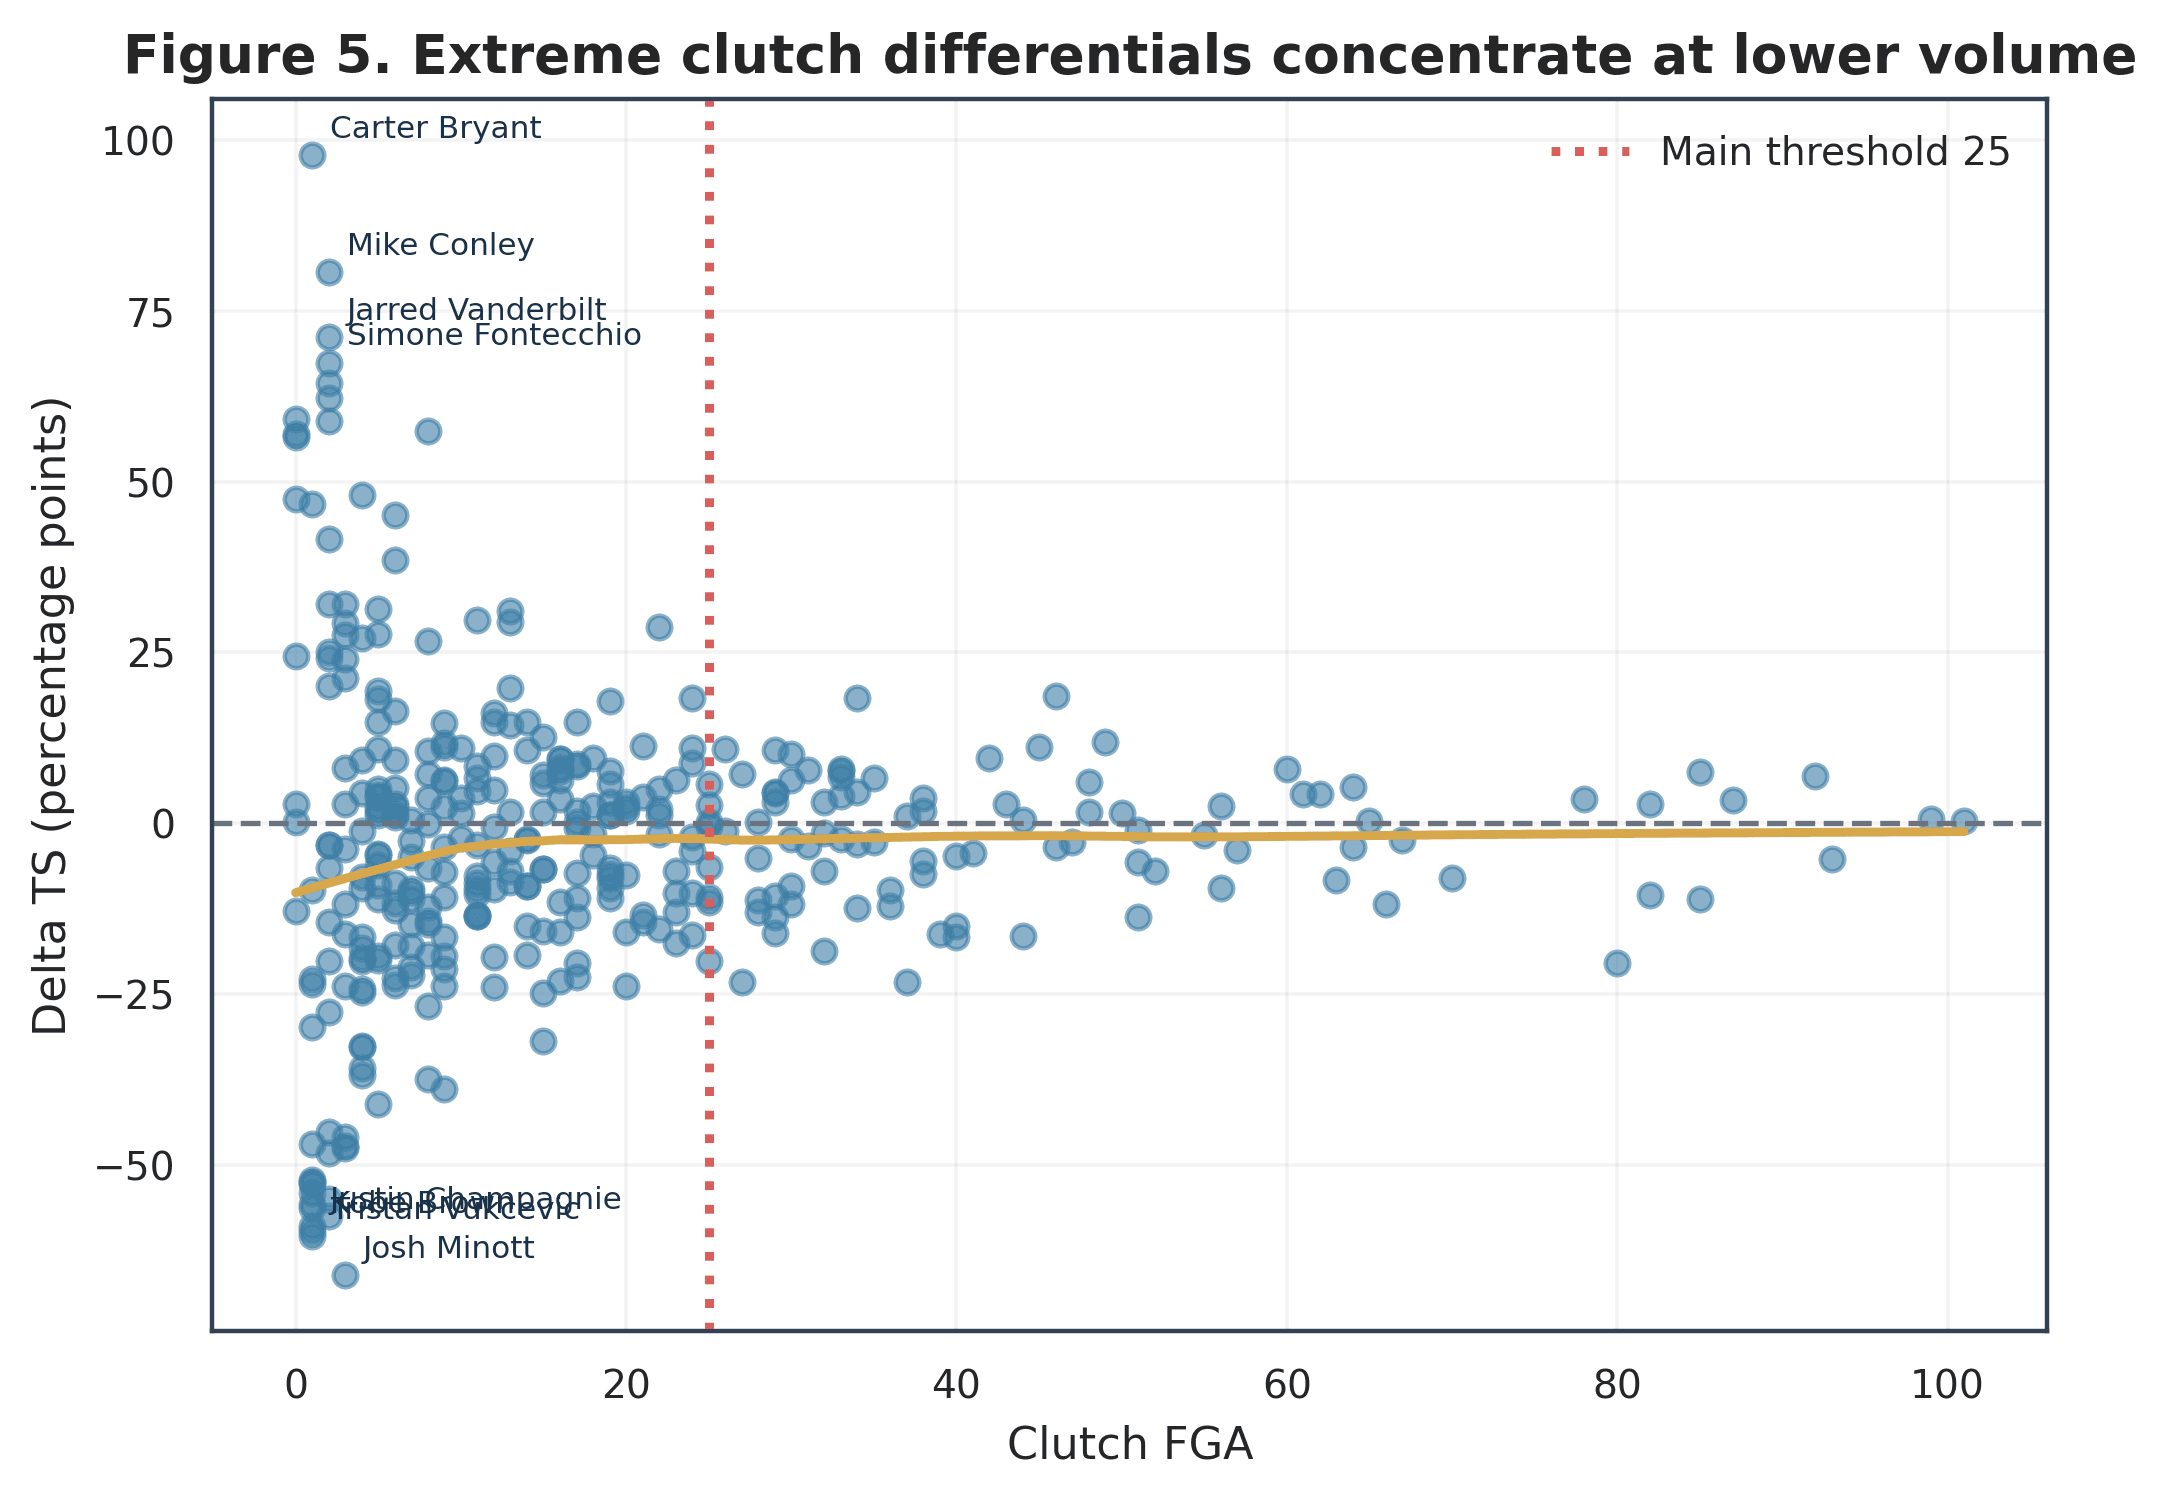
InterpretationThe most extreme differentials occur more often near lower attempt volumes, supporting the treatment of clutch FGA primarily as a reliability variable.
LimitationA volume relationship does not make high-volume estimates certain, and the eligibility screen selects for players who received close-game opportunities.
Offensive predictors
Shot entropy summarizes how evenly a player's non-clutch attempts span court zones, normalized for the number of available zones. The Self-Creation Index combines pull-up frequency, the inverse of catch-and-shoot frequency, and non-clutch workload as a transparent proxy; it is not a direct record of unassisted creation. Free-throw and three-point rates describe scoring mix, assists and turnover rate describe playmaking and possession control, and baseline TS anchors the change score.
The feature set is deliberately small and interpretable. None of these variables directly measures composure, defender distance, play calls, fatigue, or decision quality under pressure, so coefficient language remains associative.
Statistical analysis
The primary model is ordinary least squares with HC3 heteroskedasticity-robust standard errors. Square-root-clutch-FGA weighted least squares checks whether higher-volume observations alter the pattern. Because change scores mechanically contain the baseline, the study also models clutch TS with baseline control and residualizes clutch TS against non-clutch TS before fitting predictors. Variance inflation, residual, influence, and heteroskedasticity diagnostics accompany the models, while false-discovery-rate correction is applied to the reported coefficient family.
The primary model's adjusted R² was 0.089. Normalized shot entropy had coefficient 0.246, 95% CI 0.058 to 0.434, nominal p = 0.0109, and FDR-adjusted p = 0.0907. Assists per 36 had coefficient 1.38 percentage points, 95% CI 0.08 to 2.69, nominal p = 0.0383, and FDR-adjusted p = 0.1596. The entropy result is a borderline adjusted association; the assists result is exploratory and does not survive within-table FDR control.
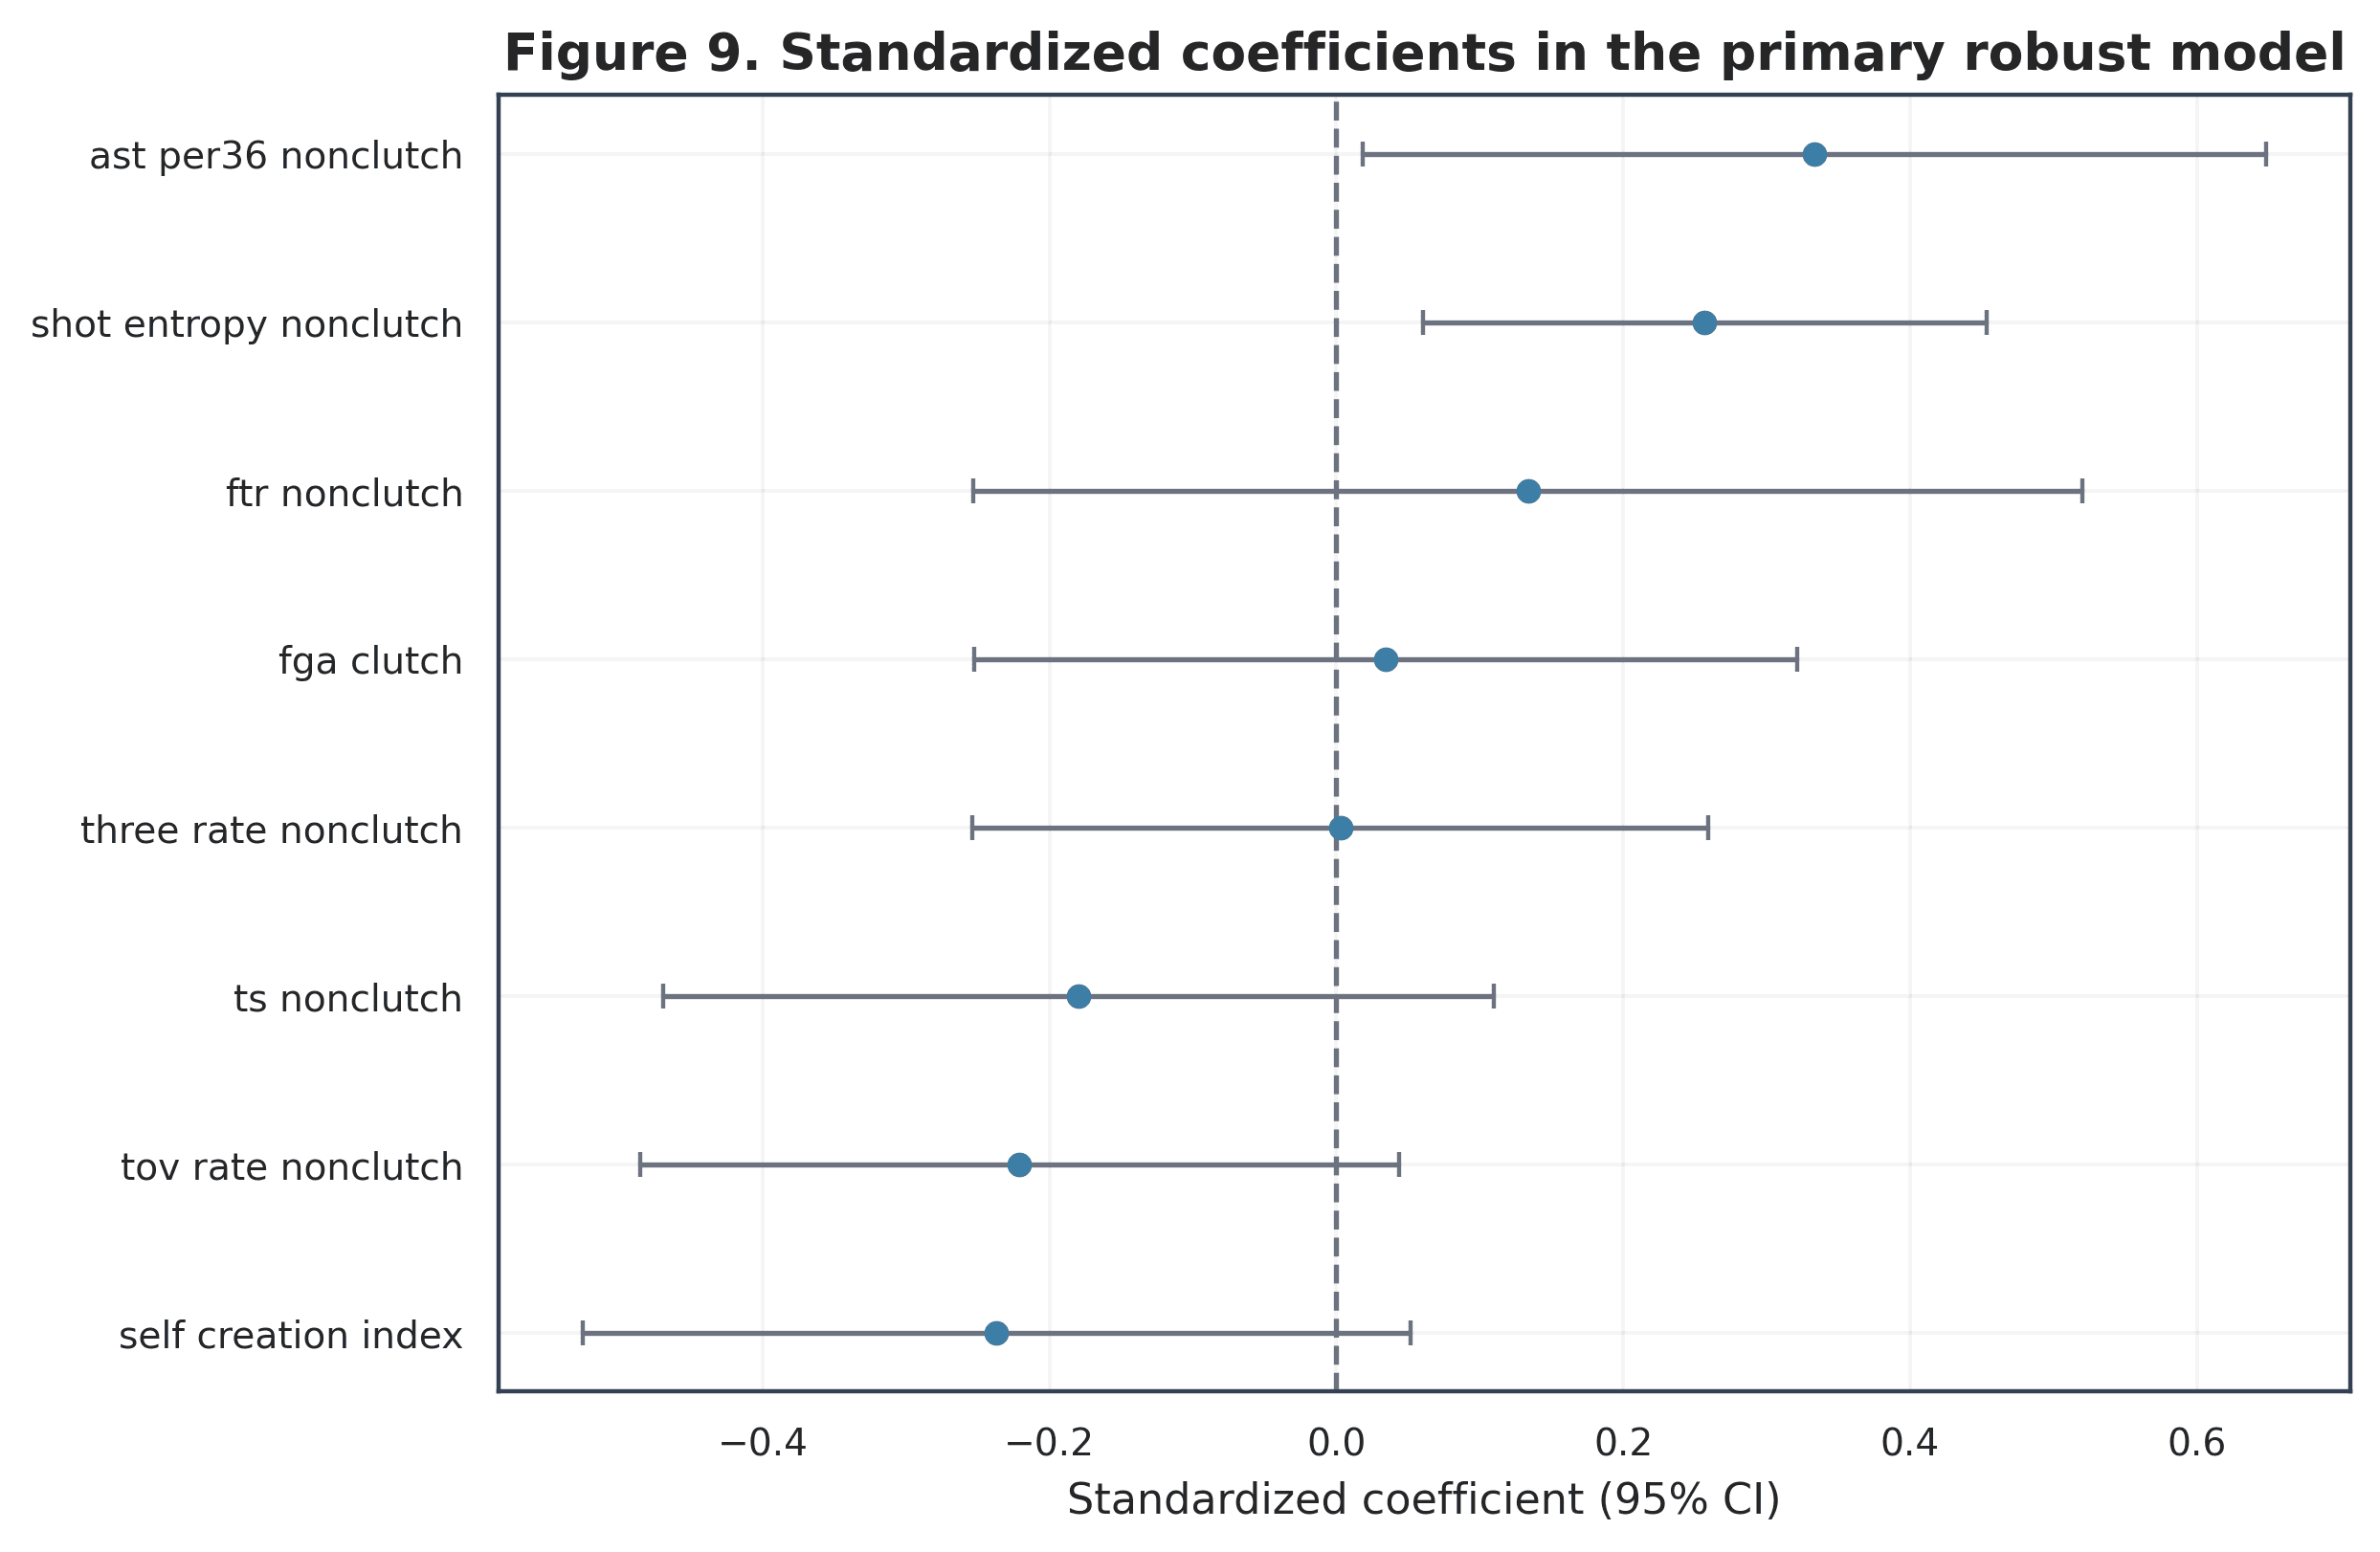
InterpretationShot entropy and assists per 36 have positive intervals that narrowly exclude zero before multiplicity adjustment; the other adjusted directions are imprecise.
LimitationThe coefficients are conditional associations in 99 selected players, and nominal confidence intervals do not replace FDR-adjusted evidence or causal identification.
Machine learning
OLS, Ridge, Lasso, Elastic Net, Random Forest, Gradient Boosting, and histogram gradient boosting were evaluated with repeated 5-fold cross-validation across 5 repetitions. Imputation, scaling, fitting, and prediction occur within training folds. Clutch volume, clutch efficiency, Delta TS, CBE, and other outcome-derived fields are prohibited as machine-learning inputs. This asks whether the measured normal-offense characteristics generalize to held-out players, not whether a flexible model can fit the full sample.
The best repeated-CV model was Random Forest: RMSE 8.78 percentage points, MAE 7.22 percentage points, and R² −0.075. Every model had negative mean held-out R². Small performance differences relative to split-to-split variation do not support a meaningful nonlinear predictive advantage.
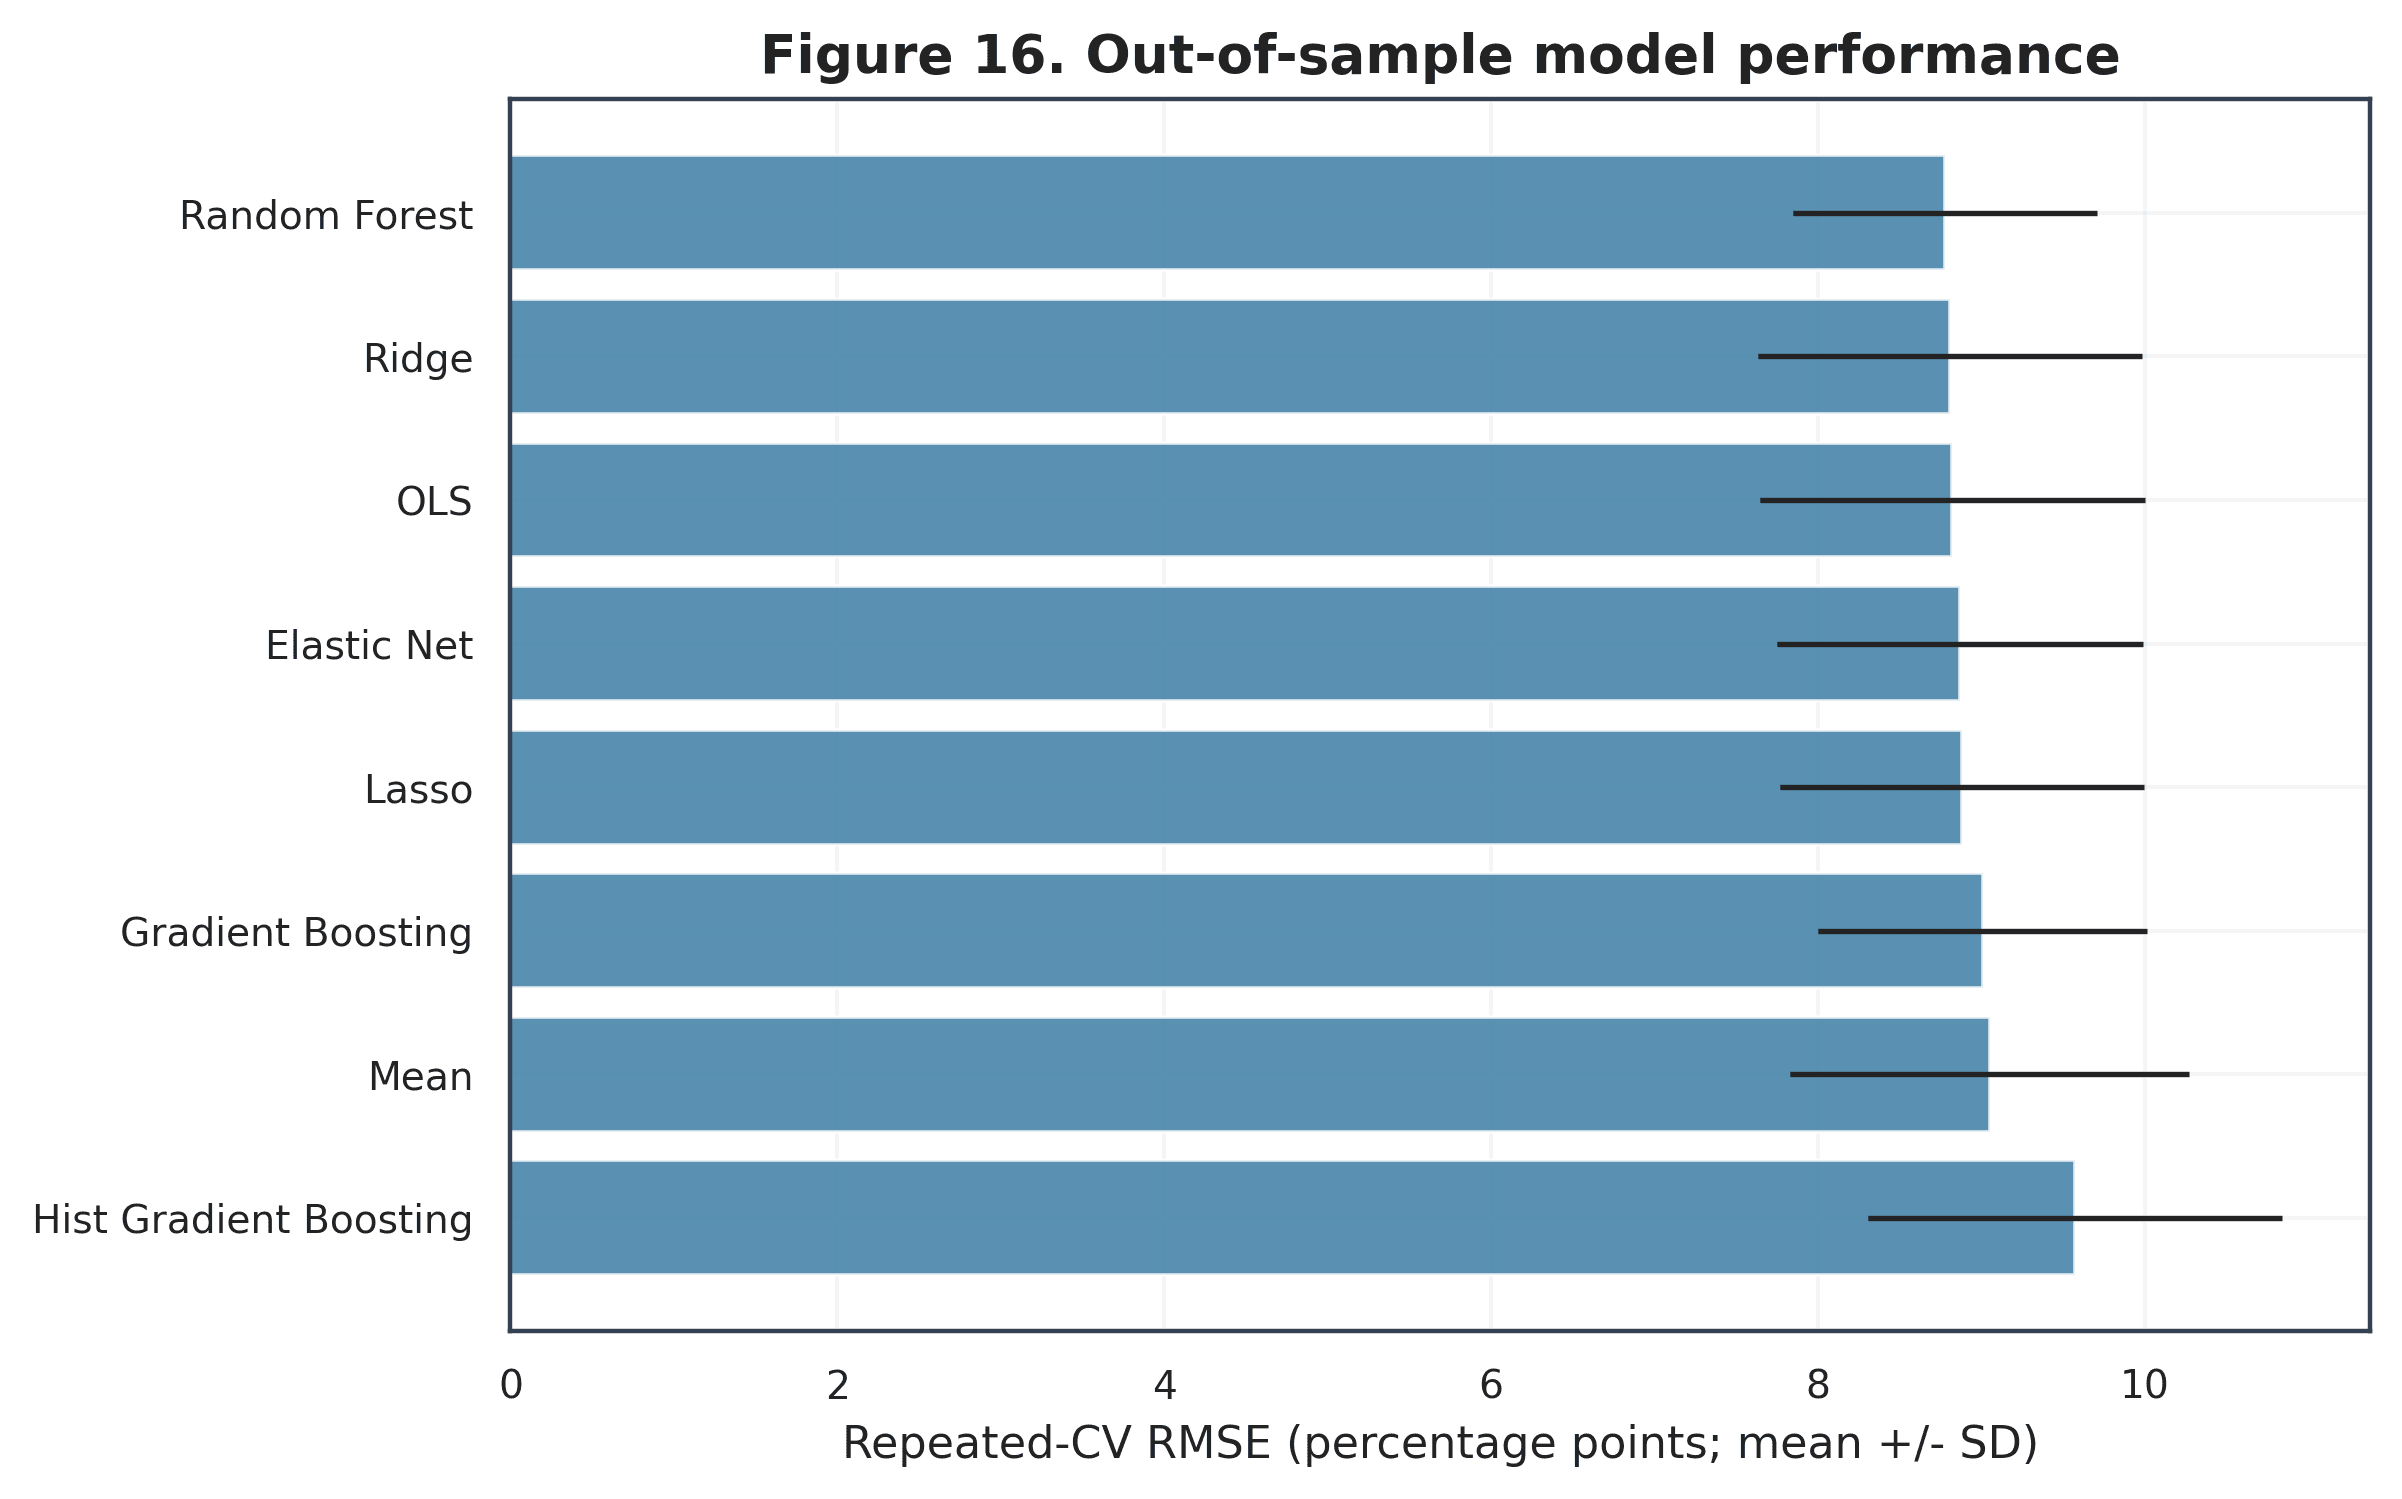
InterpretationRandom Forest has the lowest mean RMSE, but its negative held-out R² shows that measured features did not reliably explain player-to-player variation beyond a constant benchmark.
LimitationWith 99 players, split-to-split variability is large; ranking models by a small RMSE difference would overstate evidence.
Archetypes
PCA and clustering use offensive variables only; Delta TS is excluded from construction so the analysis cannot build groups around the outcome. The resulting three labels—perimeter-oriented scorers, primary self-creators, and rim-pressure finishers—summarize overlapping role continua rather than permanent player types.
The archetype comparison was not significant: Kruskal-Wallis p = 0.4848 (0.485 rounded). Broad normal-condition role profiles did not reliably separate clutch-efficiency changes.
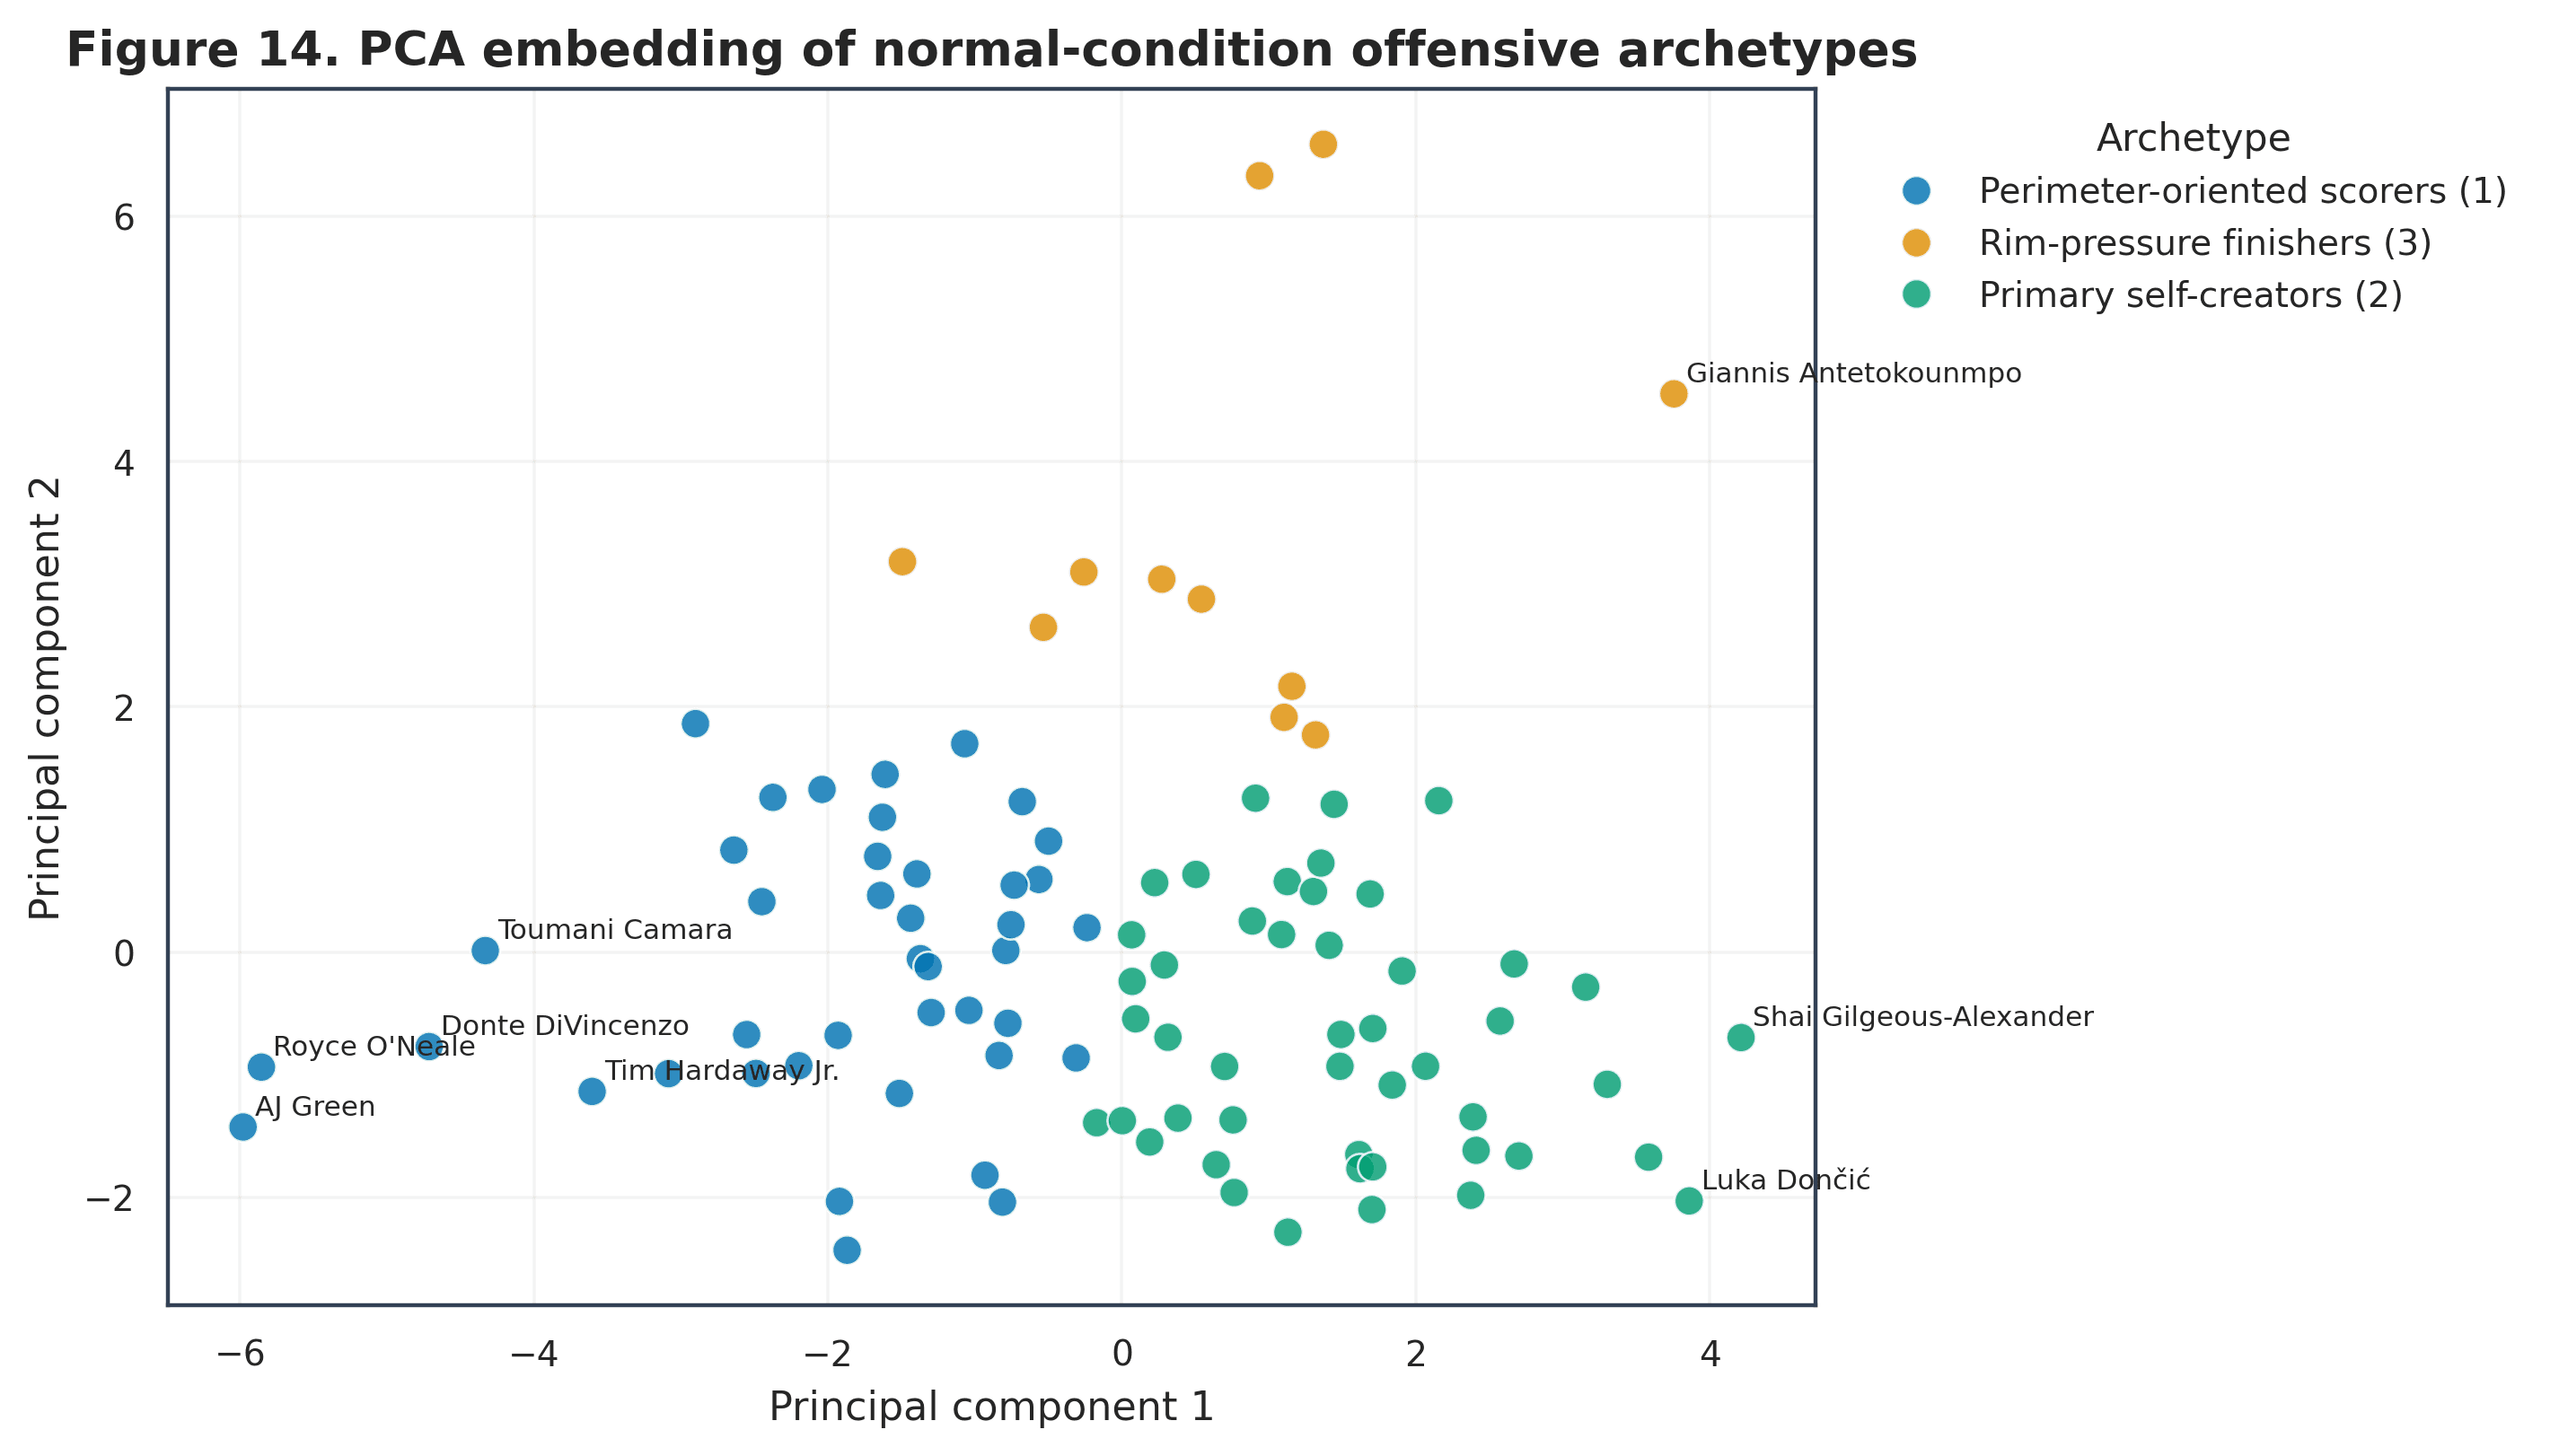
InterpretationThe three groups overlap in PCA space, reflecting mixed modern offensive roles rather than sharply separated player species.
LimitationCluster labels compress continuous offensive profiles, and the smallest group contains only 11 players; the map does not establish different clutch outcomes.
Uncertainty
Player uncertainty intervals use 1,000 parametric-bootstrap draws of clutch and non-clutch shooting components. At the player level, two-point, three-point, and free-throw components were also shrunk separately with empirical-Bayes priors before expected points and TS were reconstructed; this avoids treating true shooting as a single binomial proportion.
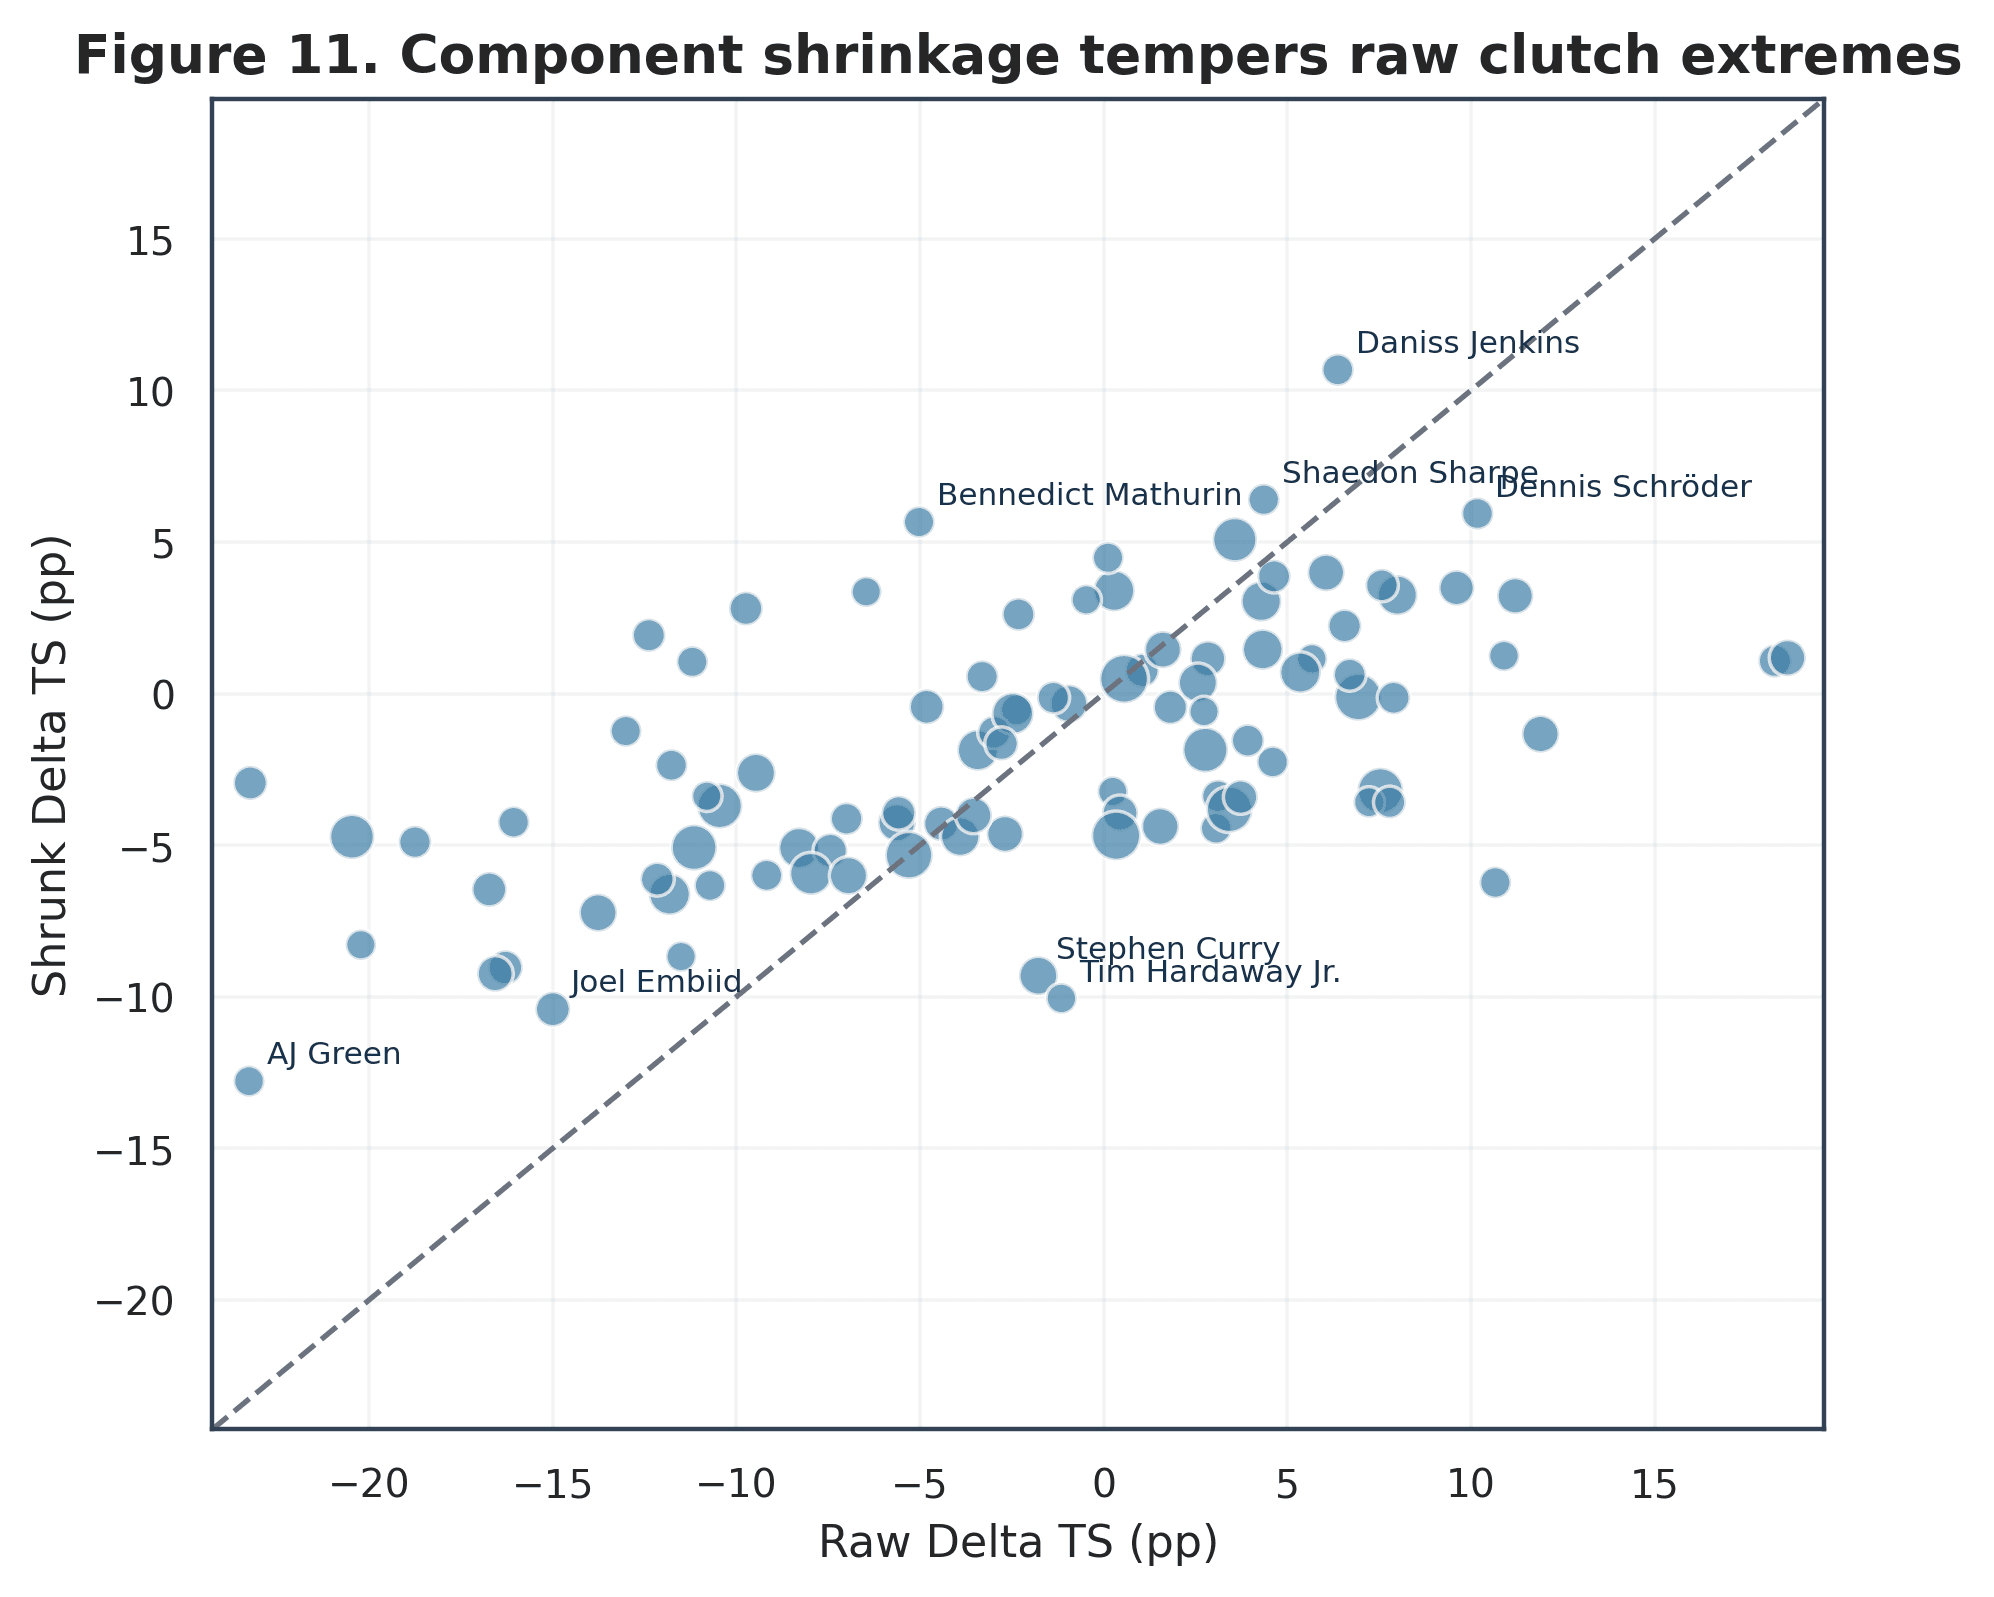
InterpretationMany positive and negative raw extremes move substantially toward zero; VJ Edgecombe's 18.62-point raw differential, for example, shrinks close to zero.
LimitationShrinkage is a conservative estimate under the component-prior model, not evidence that the observed extremes did not occur.
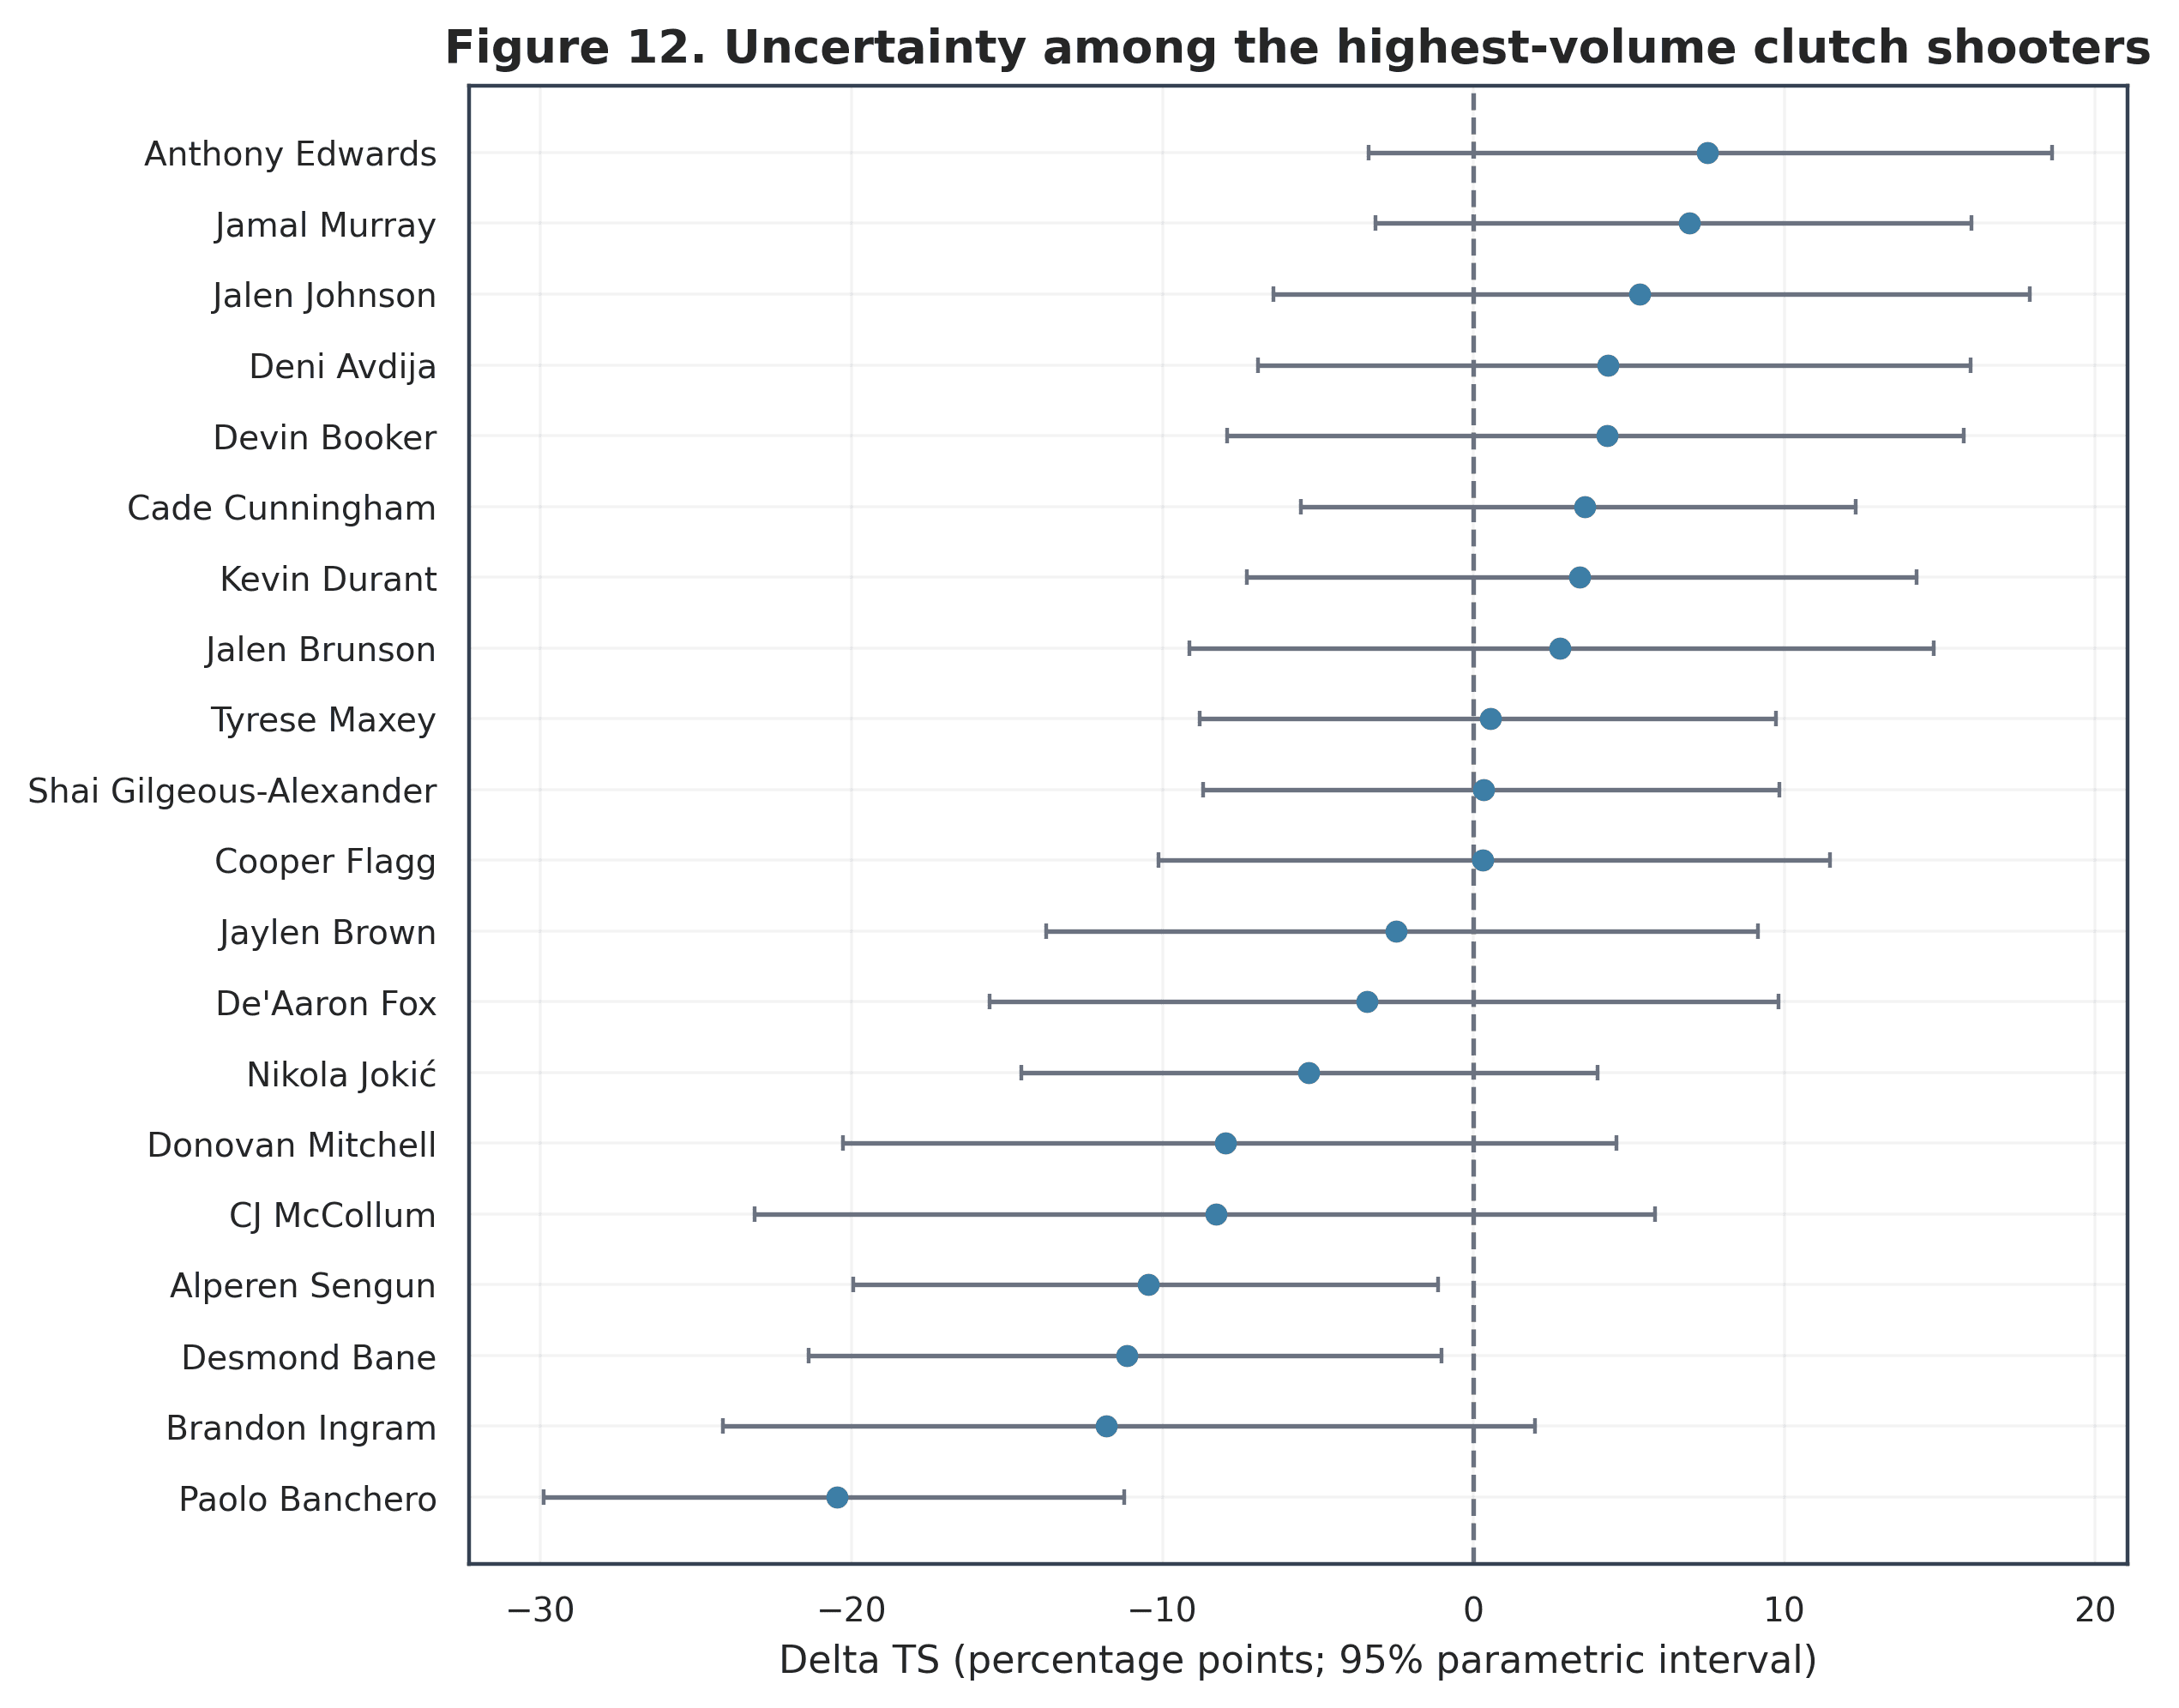
InterpretationMost high-volume intervals cross zero; Paolo Banchero's interval remains entirely negative while many positive point estimates span decline and improvement.
LimitationThe intervals use parametric approximations and cannot incorporate every contextual source of dependence or shot difficulty.
Each player also received 10,000 Monte Carlo draws under their non-clutch two-point, three-point, and free-throw component rates while retaining observed clutch attempt composition. The resulting project-defined Clutch Beyond Expectation (CBE) score standardizes distance from that simulated expectation; it asks whether the observed shooting sample was unusual under a specific baseline, not why.
VJ Edgecombe had the highest adequate-volume CBE, 2.09, and Paolo Banchero the lowest, −3.67. These are unusual 2025-26 seasons, not fixed identities. CBE is project-defined and is not proof of psychological clutch ability.
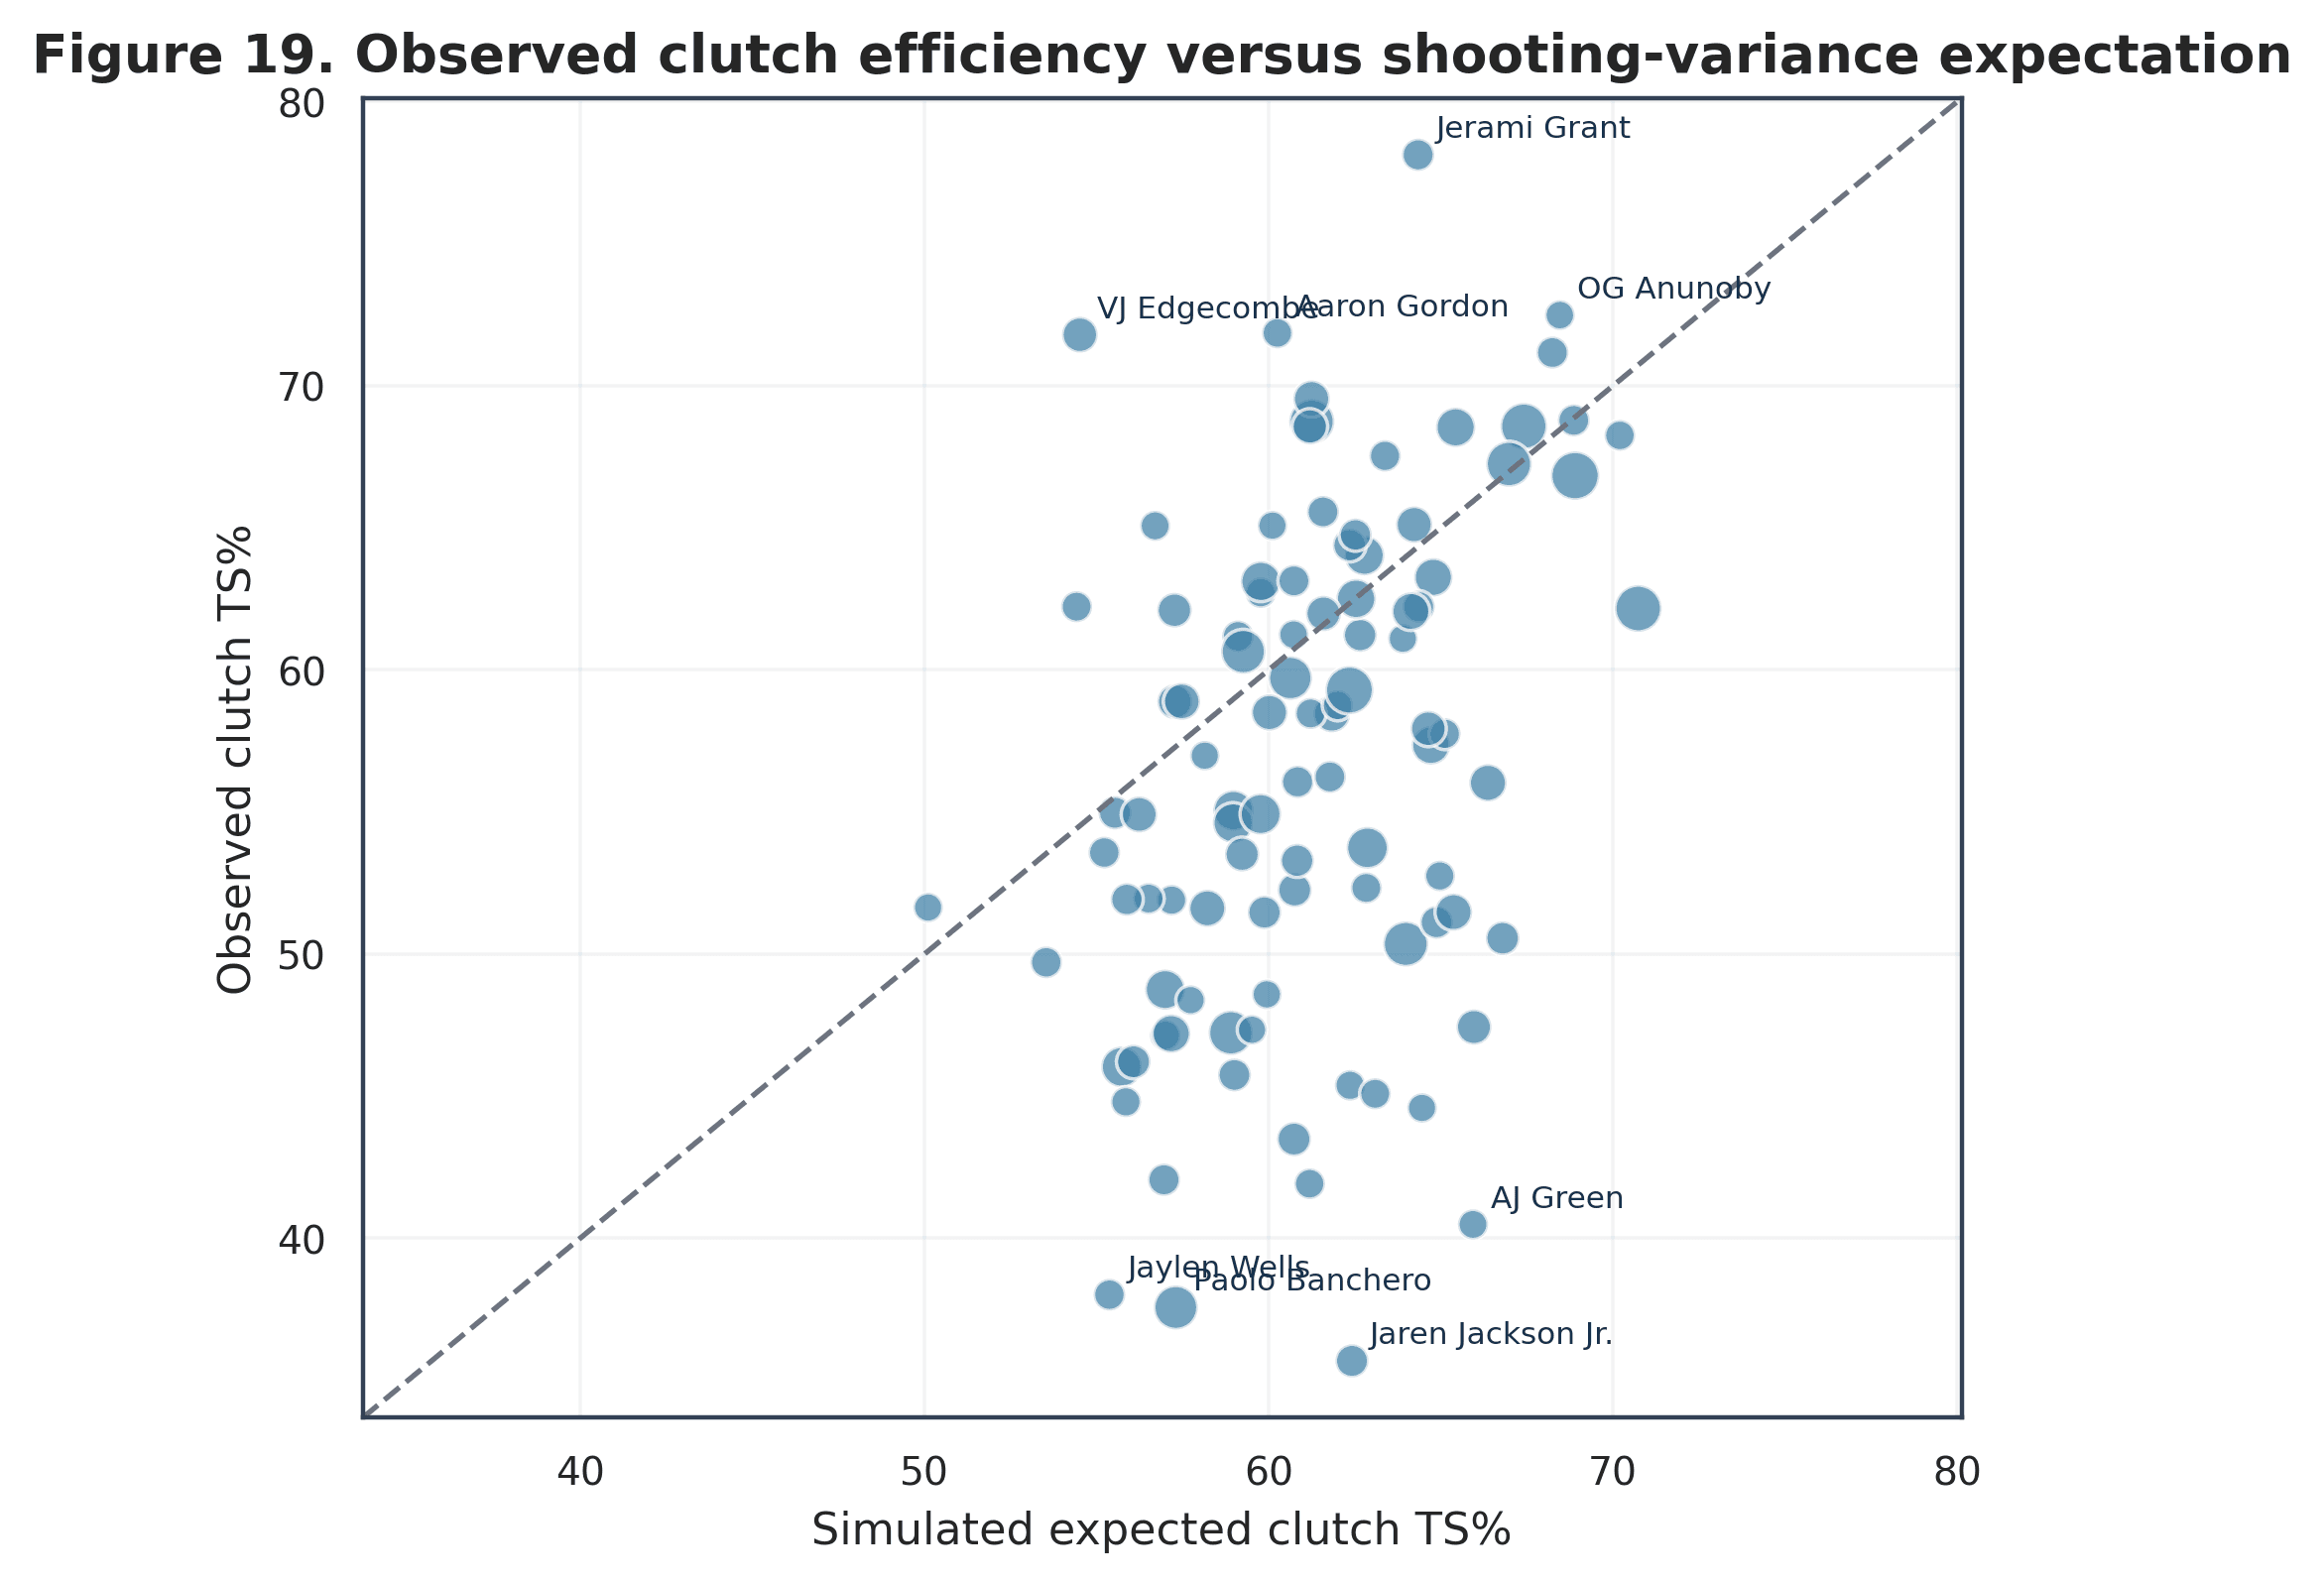
InterpretationMost players lie near the identity line, so their observed component shooting is plausible under the player-specific non-clutch baseline and clutch attempt mix.
LimitationThe simulation does not explain departures and assumes independent component makes without defender, sequence, or game-state context.
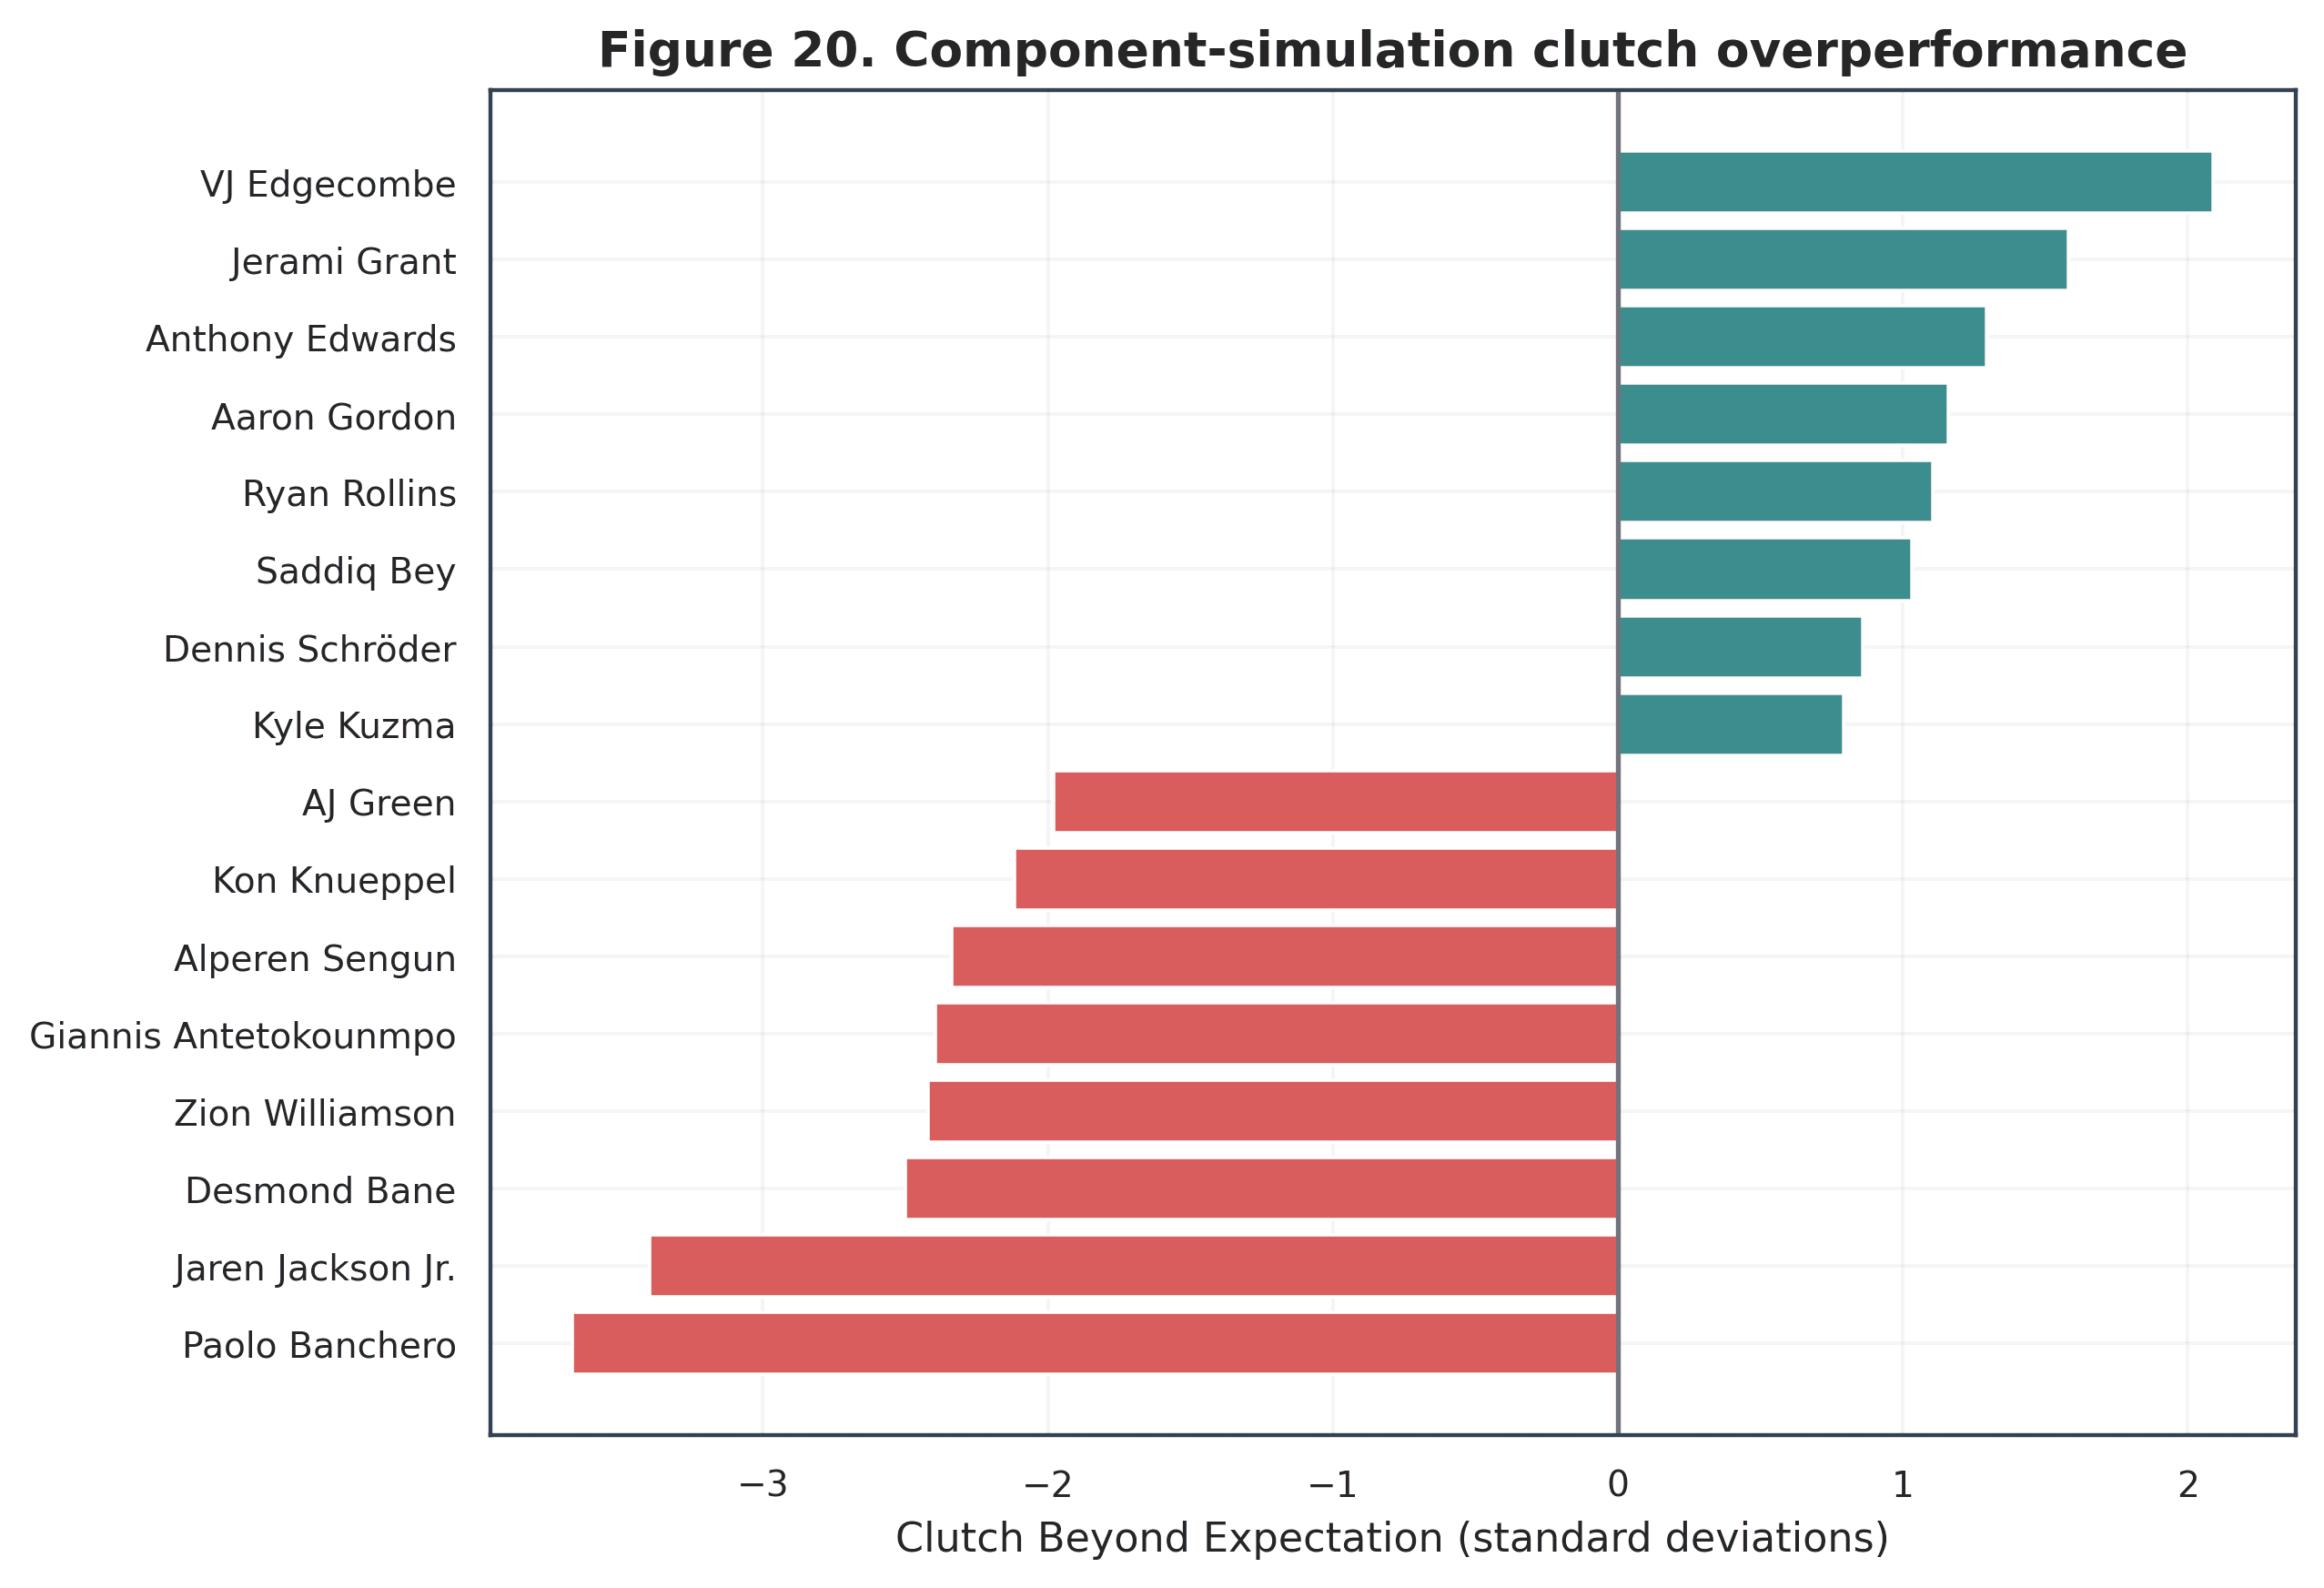
InterpretationVJ Edgecombe's CBE of 2.09 and Paolo Banchero's CBE of −3.67 are the most unusual adequate-volume results relative to their simulated baselines.
LimitationA selected tail ranking compounds multiple-comparison and winner's-curse concerns; CBE is a screening statistic, not a stable trait label.
Multi-season stability
Adjacent-season matching across 2022-23 through 2025-26 tests whether the single-season differential repeats.
The weakening sequence, small Spearman correlations, and near-boundary random-effect estimate provide limited evidence for a stable player-level effect.
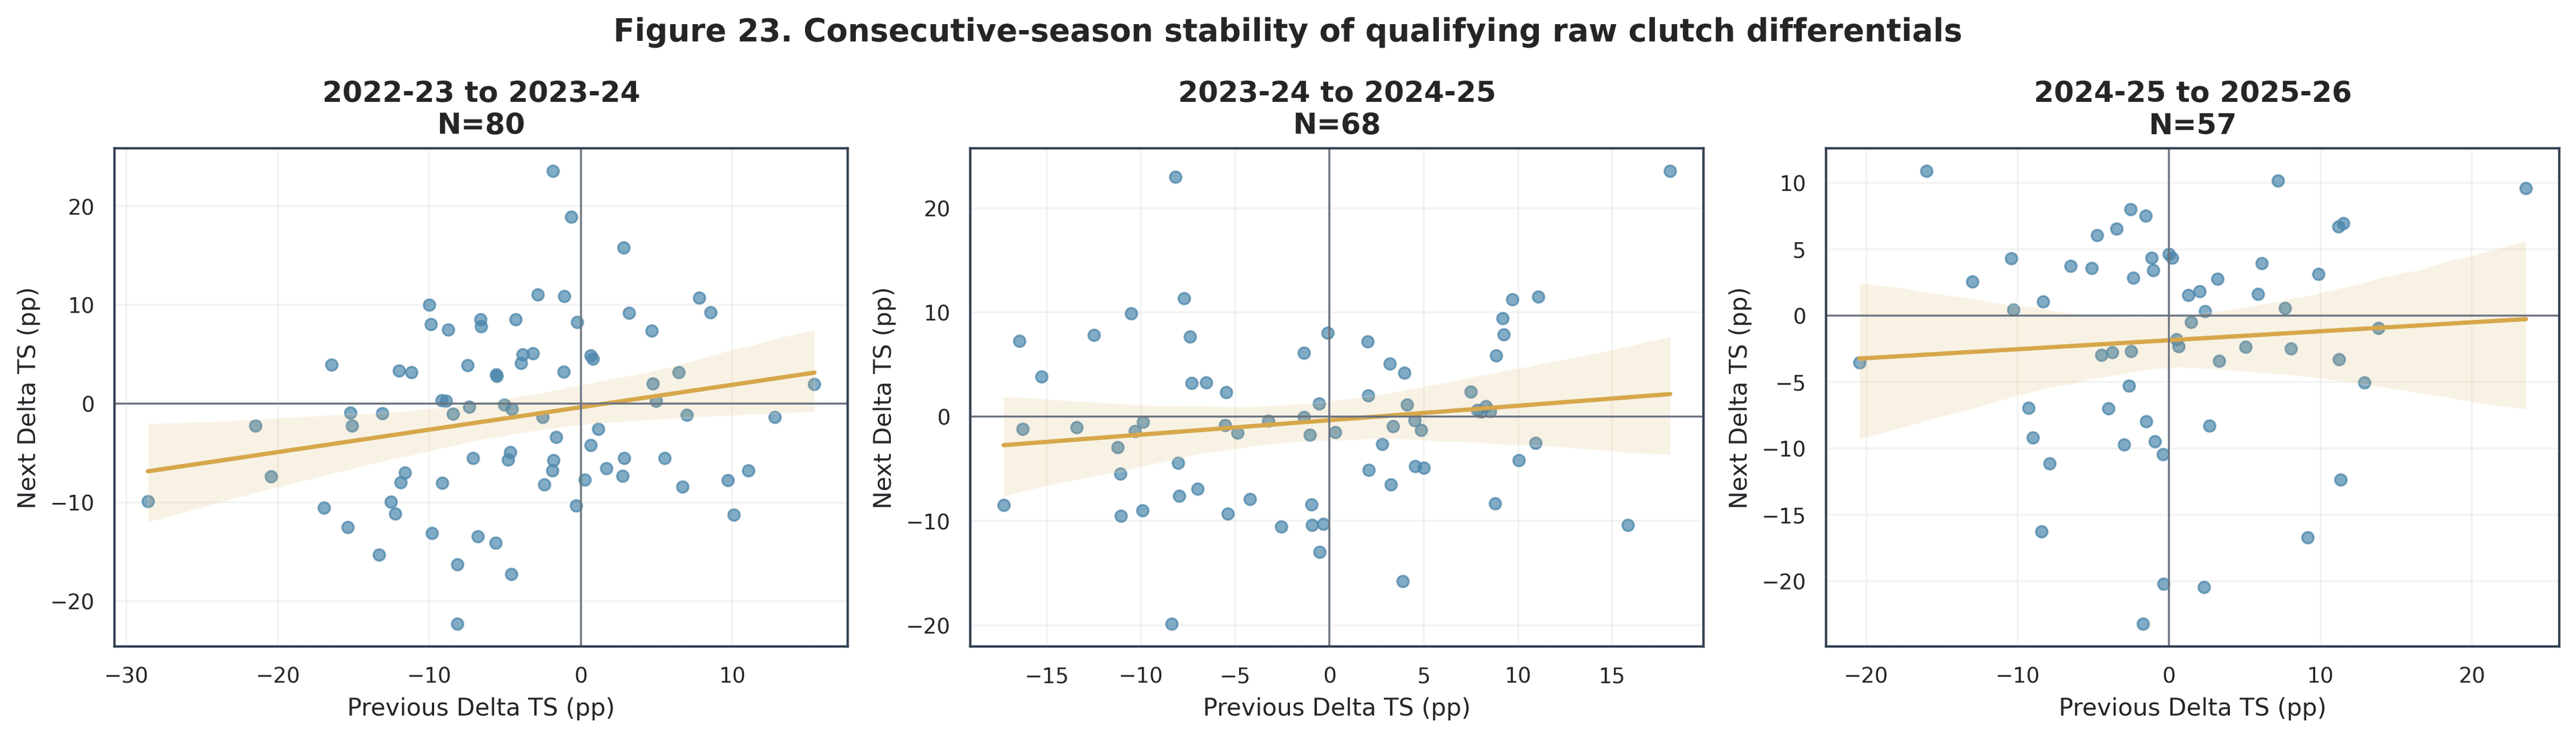
InterpretationThe fitted relationships are weak and the most recent Pearson correlation is only 0.068, indicating little year-to-year persistence among qualifying players.
LimitationEligibility, team, role, age, and health can change between seasons, and four seasons cannot precisely identify a persistent latent player effect.
An explicitly exploratory pooled screen covered 83 players with at least three qualifying seasons. Derrick White led it with 3 qualifying seasons, 102 pooled clutch FGA, Delta TS +16.01 percentage points, and CBE 2.05; his one-sided p-value was 0.0232, but his screen-wide FDR-adjusted p-value was 0.9999. Selection as the maximum across the screen makes the adjusted result the appropriate evidentiary reference, so this is a candidate for out-of-time replication rather than confirmation of persistent ability.
Robustness
Sensitivity analyses varied the clutch rule, minimum clutch FGA from 10 through 40, Delta TS versus alternative outcomes, and OLS-HC3, square-root-volume WLS, and Ridge specifications. Alternative rules included the last three minutes within five points, last two minutes within three points, and last minute within three points. Specifications too small for their predictor count were skipped rather than reported opportunistically.
The Self-Creation estimate changed direction and magnitude across definitions and thresholds; pre-specified quadratic and interaction terms did not survive FDR adjustment. The residualized outcome retained the main entropy and assist directions, while influence checks and weighting did not convert the study into a strong predictive result. The standard definition remains primary; tighter definitions are robustness checks, not opportunities to select a favorable narrative.
Limitations
Conclusion
Shot entropy supplied the clearest positive adjusted association and assists per 36 added an exploratory signal, but neither established a durable predictive rule. The primary adjusted R² was 0.089, the best held-out R² was −0.075, archetypes did not separate outcomes, and adjacent-season correlations remained small.
The stronger evidence concerns uncertainty: the average qualifying player declined modestly, raw cross-player dispersion contracted 52.5% after component shrinkage, and most high-volume intervals crossed zero. Responsible evaluation therefore combines absolute efficiency, within-player non-clutch baselines, volume, uncertainty, and multi-season evidence. One-season leaders and laggards are observations worth explaining, not measurements of character.
References
- [1]
Patel, S., & contributors. (2026). nba_api: An API client package to access NBA.com APIs (Version 1.11.4). Computer software. Source
- [2]
Cao, Z., Price, J., & Stone, D. F. (2011). Performance under pressure in the NBA. Journal of Sports Economics, 12(3), 231-252. Source
- [3]
Gilovich, T., Vallone, R., & Tversky, A. (1985). The hot hand in basketball: On the misperception of random sequences. Cognitive Psychology, 17(3), 295-314. Source
- [4]
Miller, J. B., & Sanjurjo, A. (2018). Surprised by the hot hand fallacy? A truth in the law of small numbers. Econometrica, 86(6), 2019-2047. Source
- [5]
Skinner, B. (2012). The problem of shot selection in basketball. PLOS ONE, 7(1), e30776. Source
- [6]
Efron, B., & Morris, C. (1975). Data analysis using Stein's estimator and its generalizations. Journal of the American Statistical Association, 70(350), 311-319. Source
- [7]
MacKinnon, J. G., & White, H. (1985). Some heteroskedasticity-consistent covariance matrix estimators with improved finite sample properties. Journal of Econometrics, 29(3), 305-325. Source
- [8]
Breiman, L. (2001). Random forests. Machine Learning, 45(1), 5-32. Source
- [9]
Hastie, T., Tibshirani, R., & Friedman, J. (2009). The elements of statistical learning (2nd ed.). Springer. Source
Complete paper
The unchanged 48-page paper preserves the complete methods, 24 numbered figures plus Figure 13b, 16 tables, references, appendices, and reproducibility notes.