Akshay Byagathvalli links the Kaggle LEGO Sets, Themes, and Minifigures (1975-2025) release, 18,540 set records with no price field, to original US retail prices from Brickset archives by exact set number. The resulting 6,524-set modern pricing sample supports hedonic, quantile and mixed-effects regression, structural-break tests, theme diversification indices and twelve machine-learning models evaluated on group-disjoint and strictly temporal holdouts. Every number below is read from the pipeline's saved results.
Set records
18,5406,524 priced, 2005-2025Price elasticity
0.6402× parts → +56% pricePer minifigure
+4.6%Holding parts, year, licensingBest held-out MAE
$8.06Extra Trees, R² 0.916To what extent do piece count, minifigure inclusion, theme identity, and release year explain variation in LEGO set prices, and how have their relative contributions changed between 1975 and 2025?
All estimates are observational associations. Prices are original US retail prices, not resale values, and release counts describe the catalogue, not sales.
Dataset
Dataset summary
LEGO Sets, Themes, and Minifigures (1975-2025) + Brickset US retail prices
- Observations
- 18,540 set records; 8,495 priced conventional sets
- Features
- Parts, minifigures, colours, theme, year, age, packaging
- Target
- Original US retail price (nominal and 2025 USD)
- Source
- Kaggle / Rebrickable; Brickset archives via jbryer/brickset and seankross/lego; FRED CPI-U
The Kaggle release contains sets, themes and minifigures but no prices and no set-to-minifigure links. Prices came from two Brickset-derived archives that agree exactly on 98.9% of the 2,496 sets they share. Gear, books, promotional items, service packs, collectible minifigures and electronic components were set aside by documented rules, and extreme sets were kept. Price coverage is sparse and selective before 2005, so the pricing models use 2005-2025.
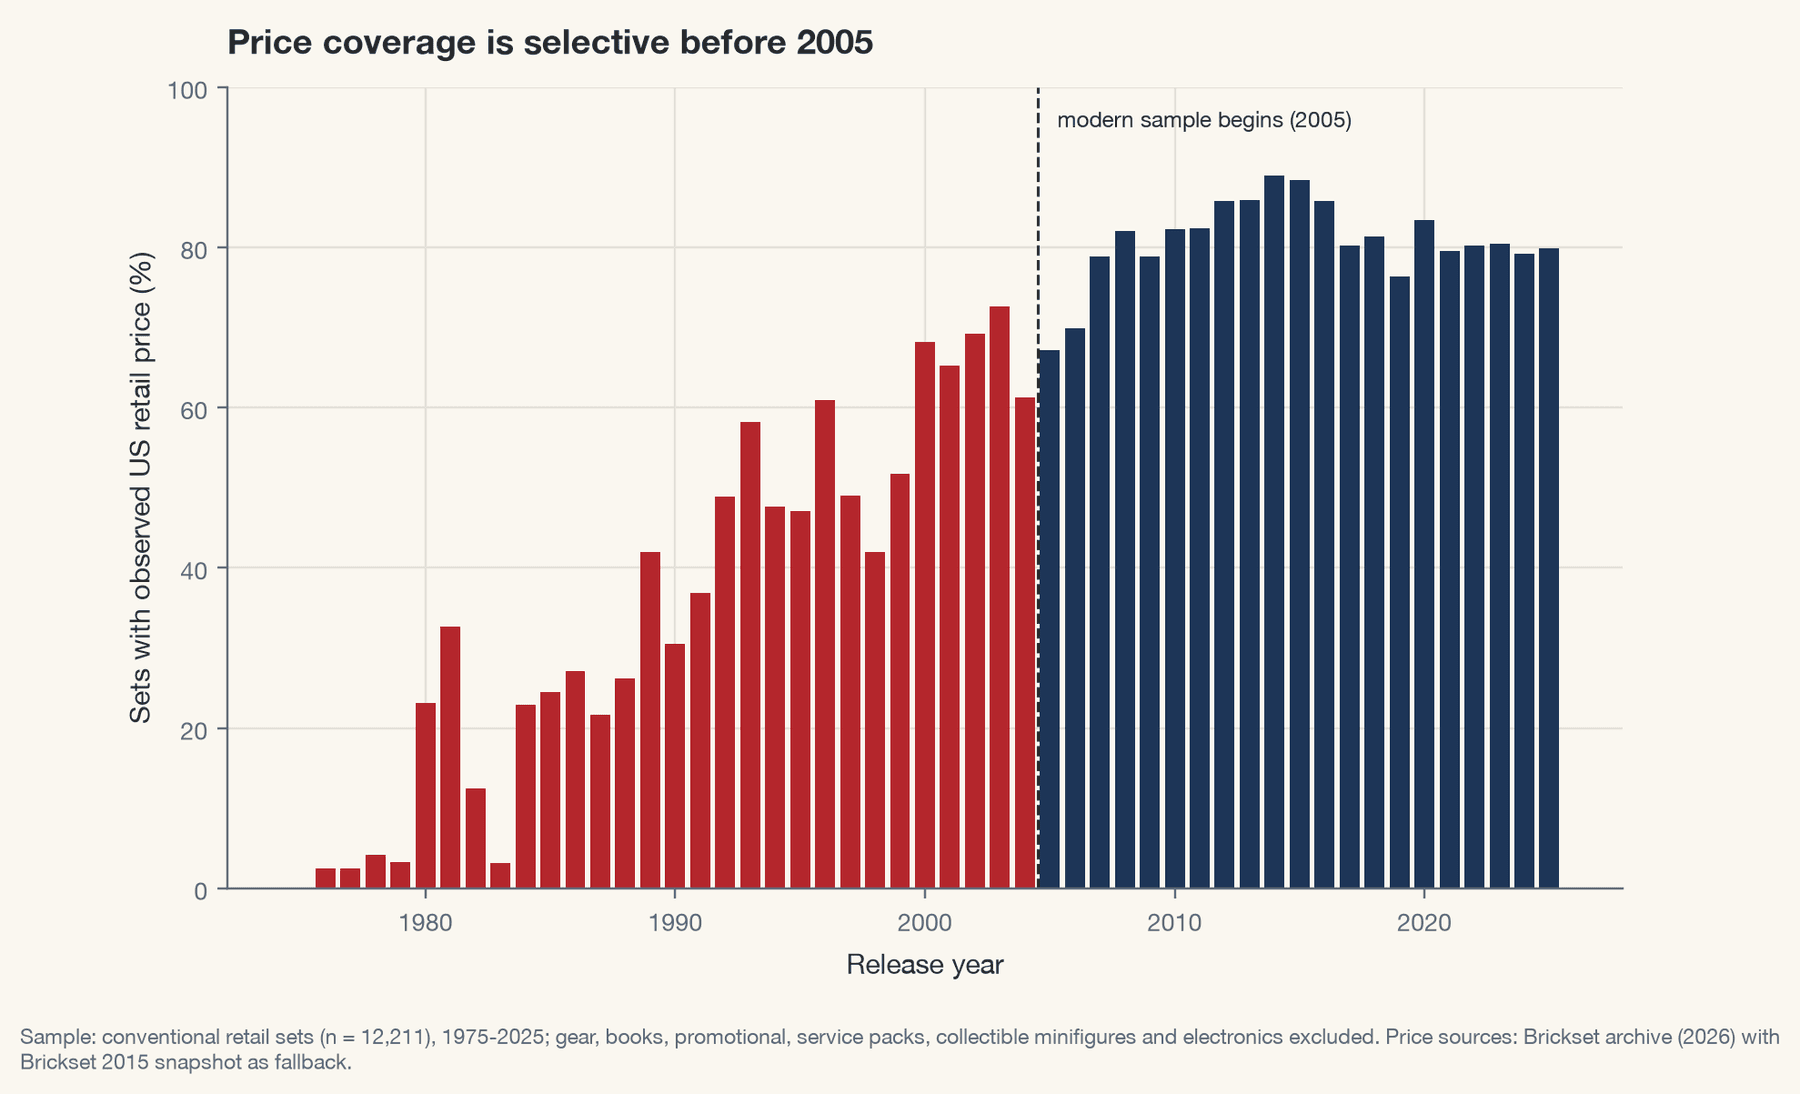
InterpretationCoverage rises from 3% of 1970s sets to 84% in the 2010s.
LimitationObserved prices over-represent larger sets, so results are conditional on price observation; inverse-probability weighting is used as a check.
Methodology
Join and audit
Measure the catalogue
Price the bricks
Predict and stress-test
Complexity
Sets got much bigger. The median conventional set had 48 parts in 1975-1984 and 228 in 2016-2025, a 375% increase (bootstrap 95% CI 283% to 432%). Robust regression puts growth at 4.71% per year; within themes it is 2.96% per year, so about two-thirds of the trend is within-theme and one-third is theme mix. The median grew faster (5.04%/yr) than the 90th percentile (3.38%/yr): growth was broad-based, not driven only by giant display sets.
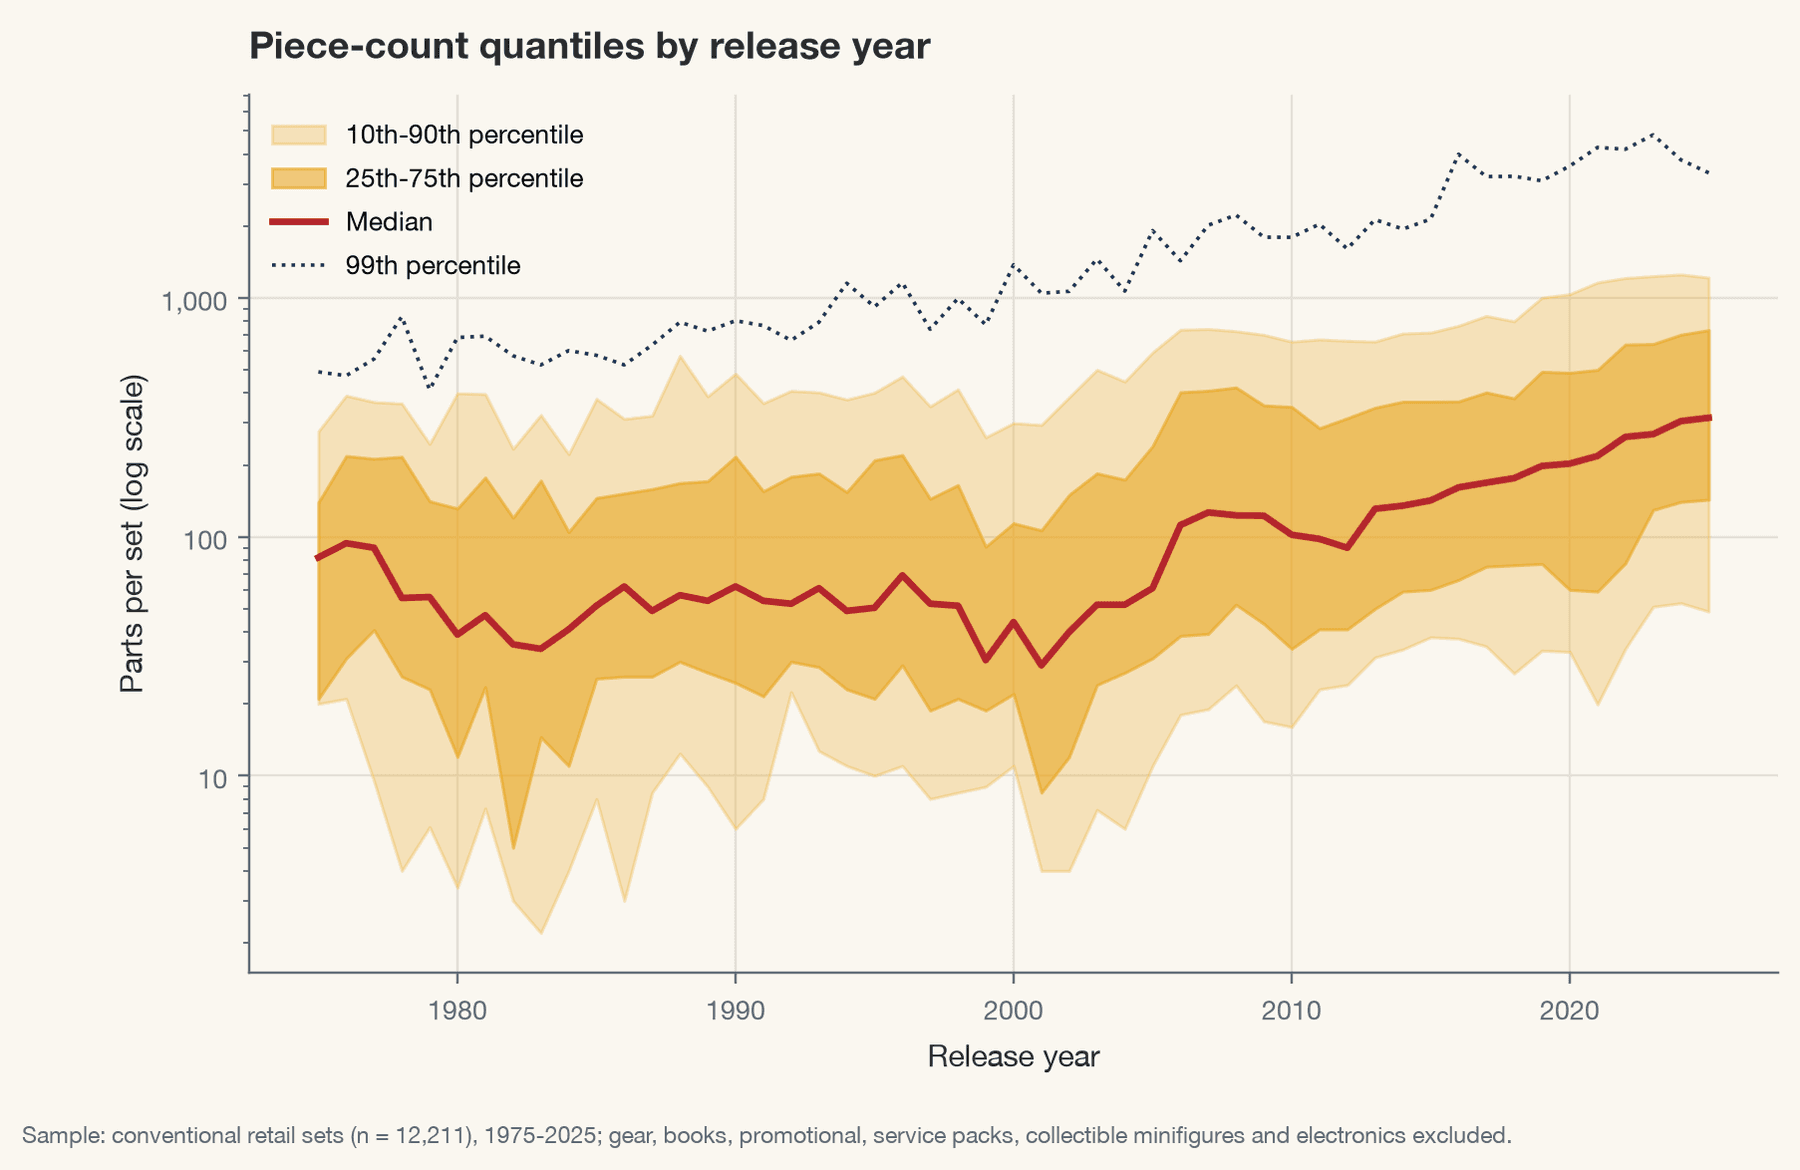
InterpretationEvery quantile rises; sets of 1,000+ parts went from none in 1975-1984 to 11.5% of releases in 2016-2025.
LimitationRebrickable part counts include some figure parts; results are robust to Brickset counts.
The catalogue also diversified. The theme HHI fell from 0.211 in 1975-1979 to 0.047 in 2021-2025, and the effective number of themes rose from 5.9 to 25.4. Median theme lifespan is 6 years.
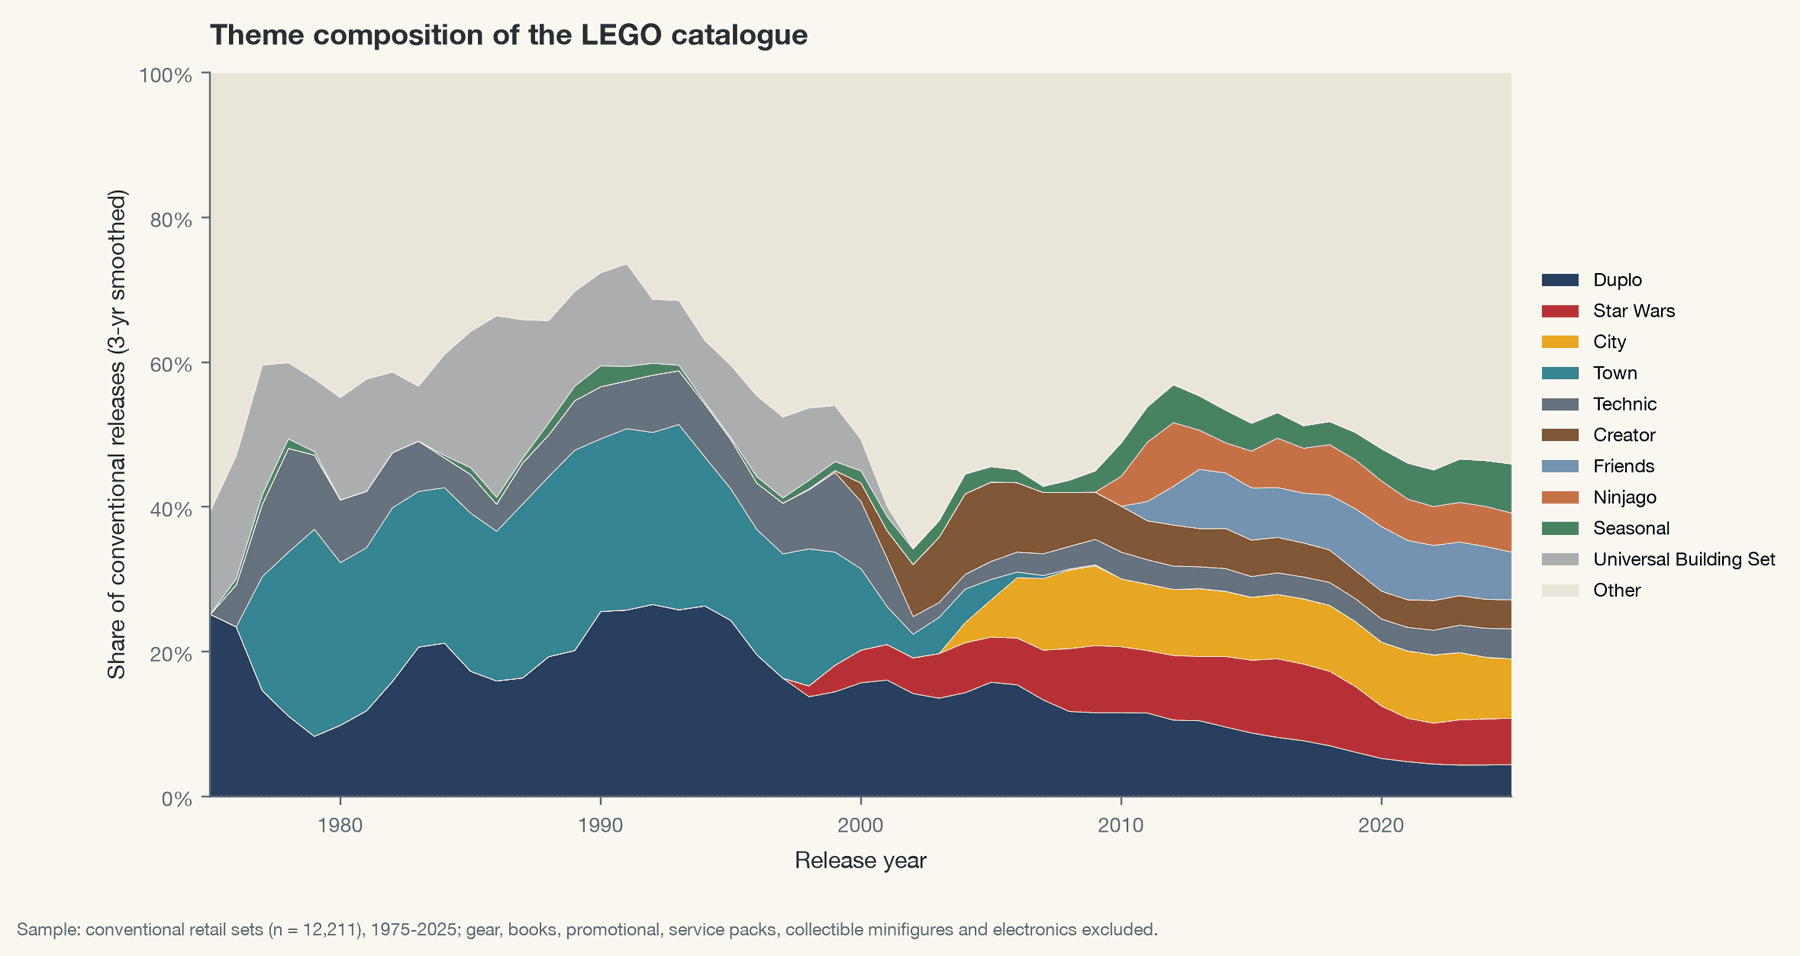
InterpretationTown and Duplo dominate the 1980s; Star Wars, City, Ninjago and Friends reshape the 2000s and 2010s.
LimitationShares count released sets, not units sold.
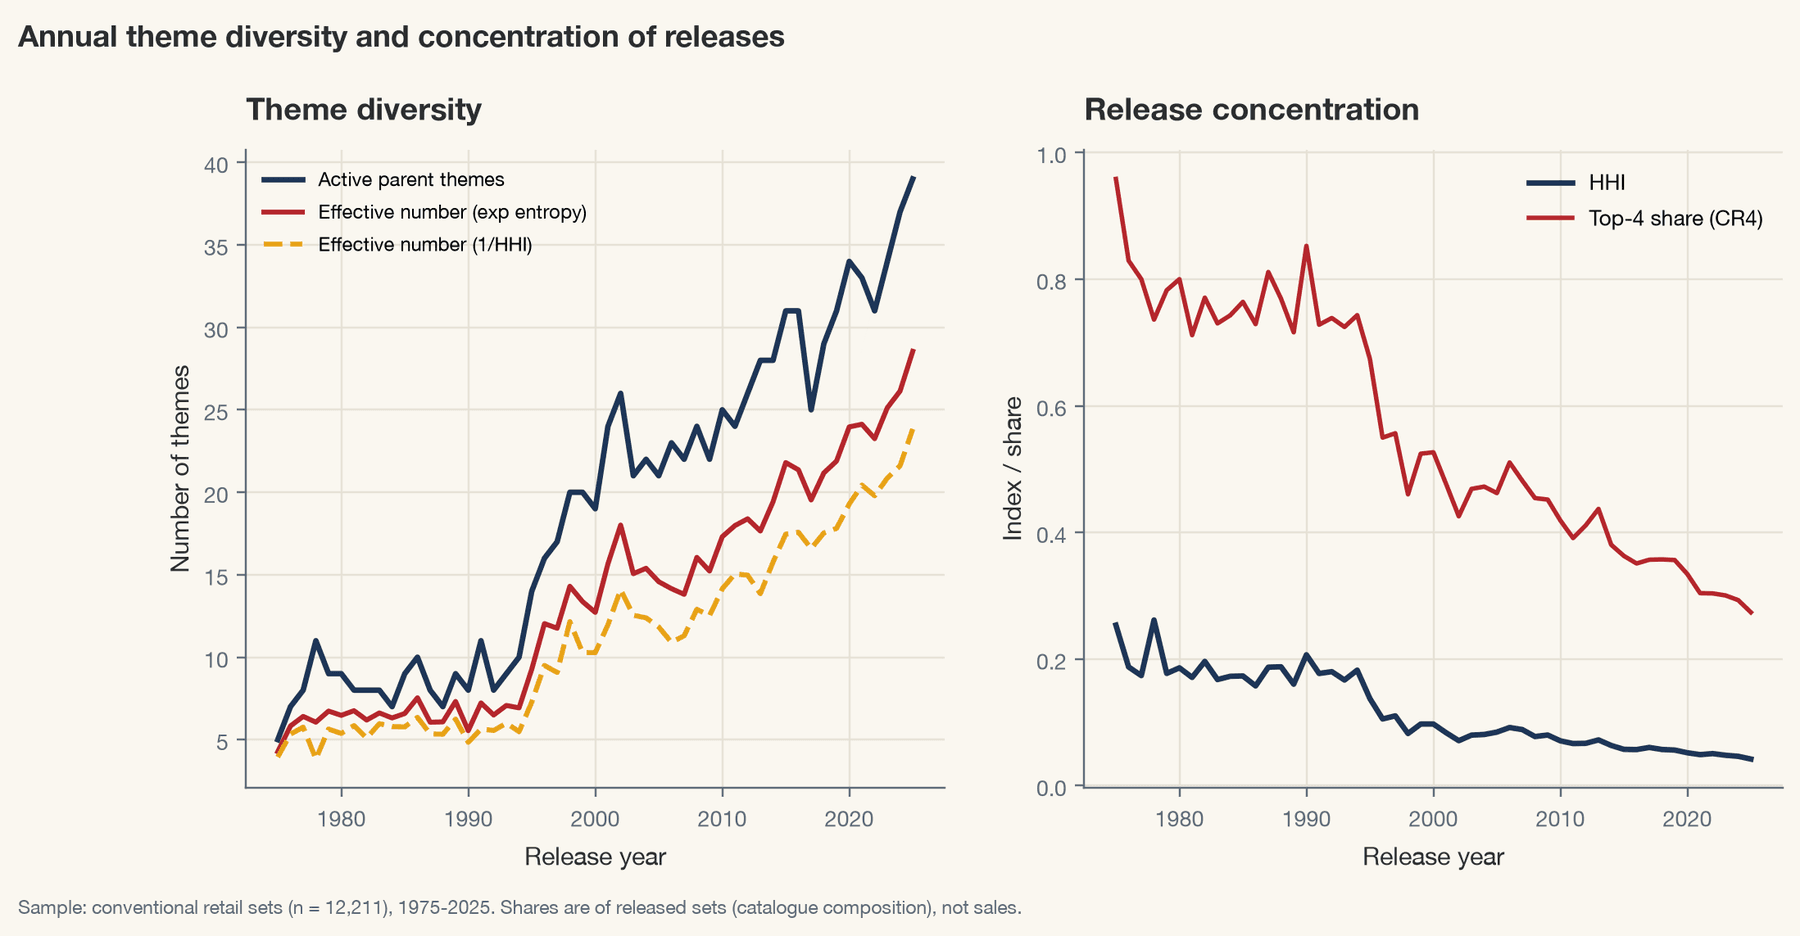
InterpretationActive parent themes rose from about 8 to 35 per year.
LimitationConcentration indices describe the release mix only.
Pricing
The log-log elasticity of price with respect to parts is 0.640 (95% CI 0.624-0.656); proportional pricing is rejected decisively. A set with twice the parts costs about 56% more, so price per piece always falls with size and is a poor yardstick across sets.
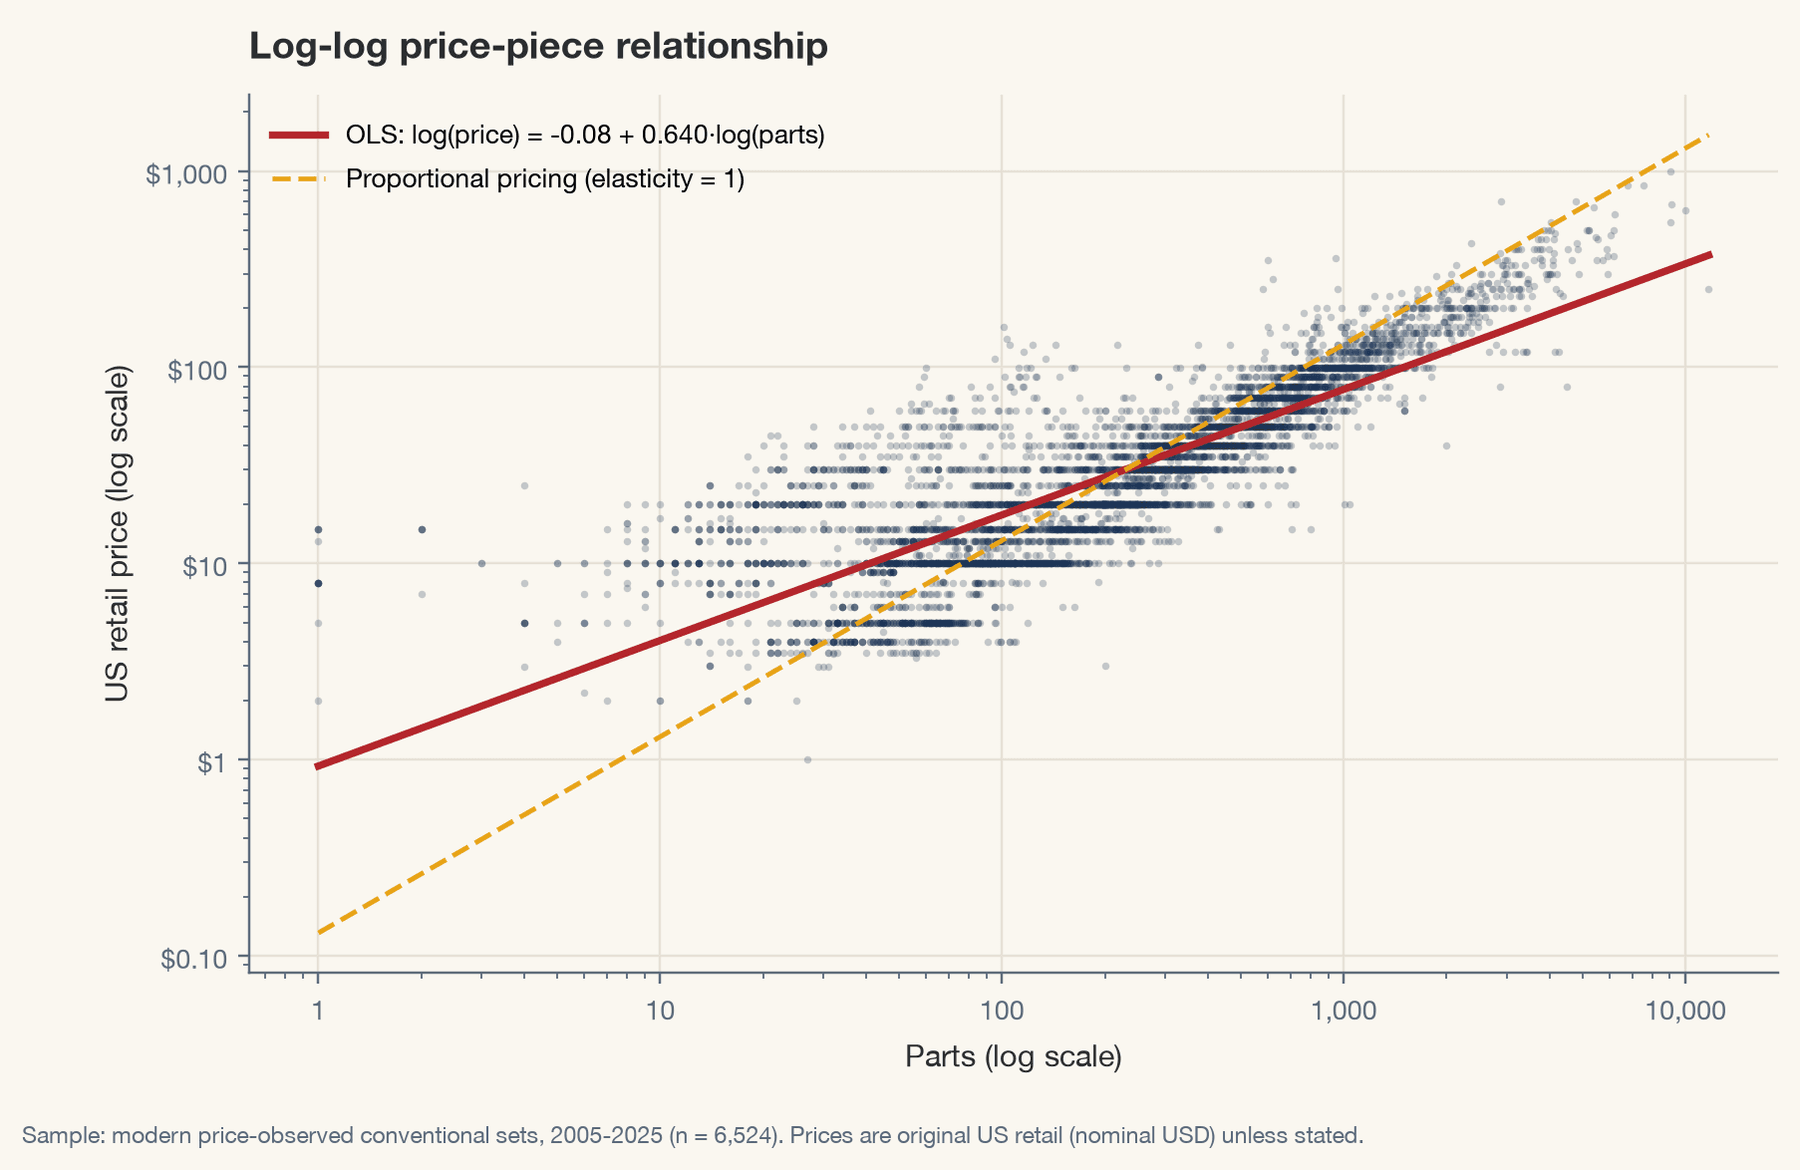
InterpretationThe fitted slope (0.640) is well below the proportional reference line.
LimitationUnadjusted for theme, minifigures and year; see the hedonic models.
Inflation changes the story. Median nominal set prices rose from $15.00 (2005) to $49.99 (2025) because sets grew, but the median real price per piece fell from $0.218 to $0.107 in 2025 dollars. Holding size, figures and licensing fixed, real prices declined 1.48% per year.
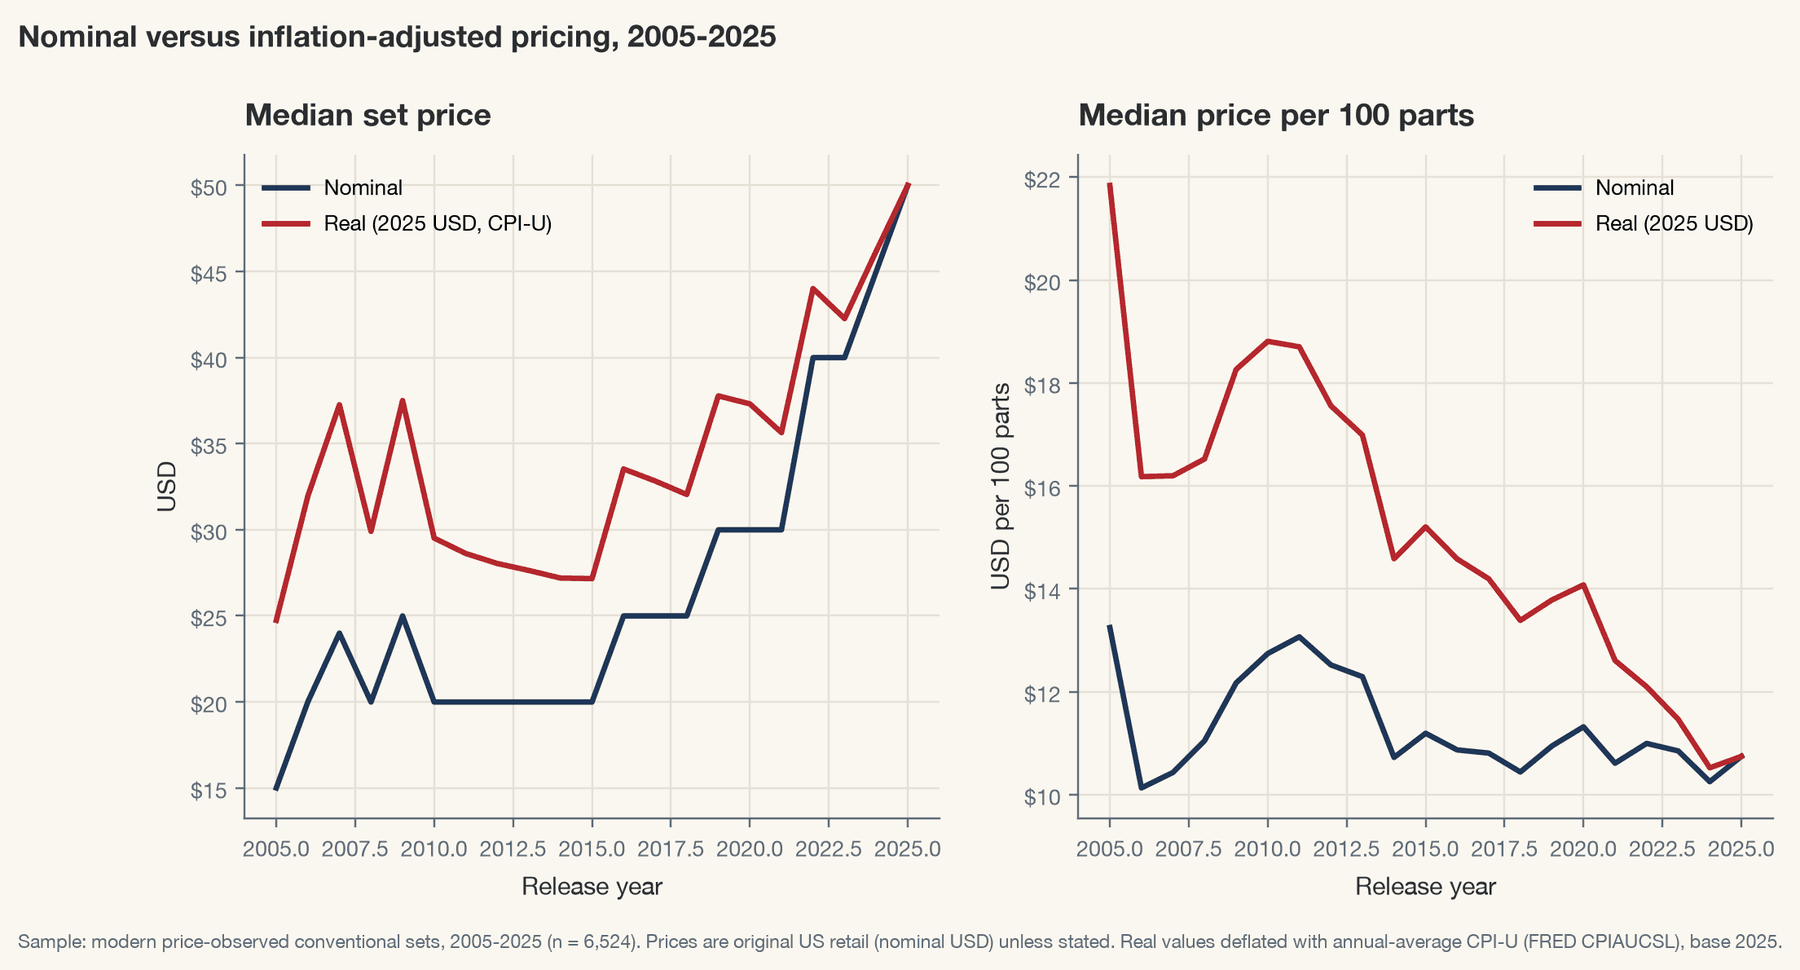
InterpretationNominal set prices rise while real price per piece falls by about half.
LimitationCPI-U is a general deflator, not a toy-specific index.
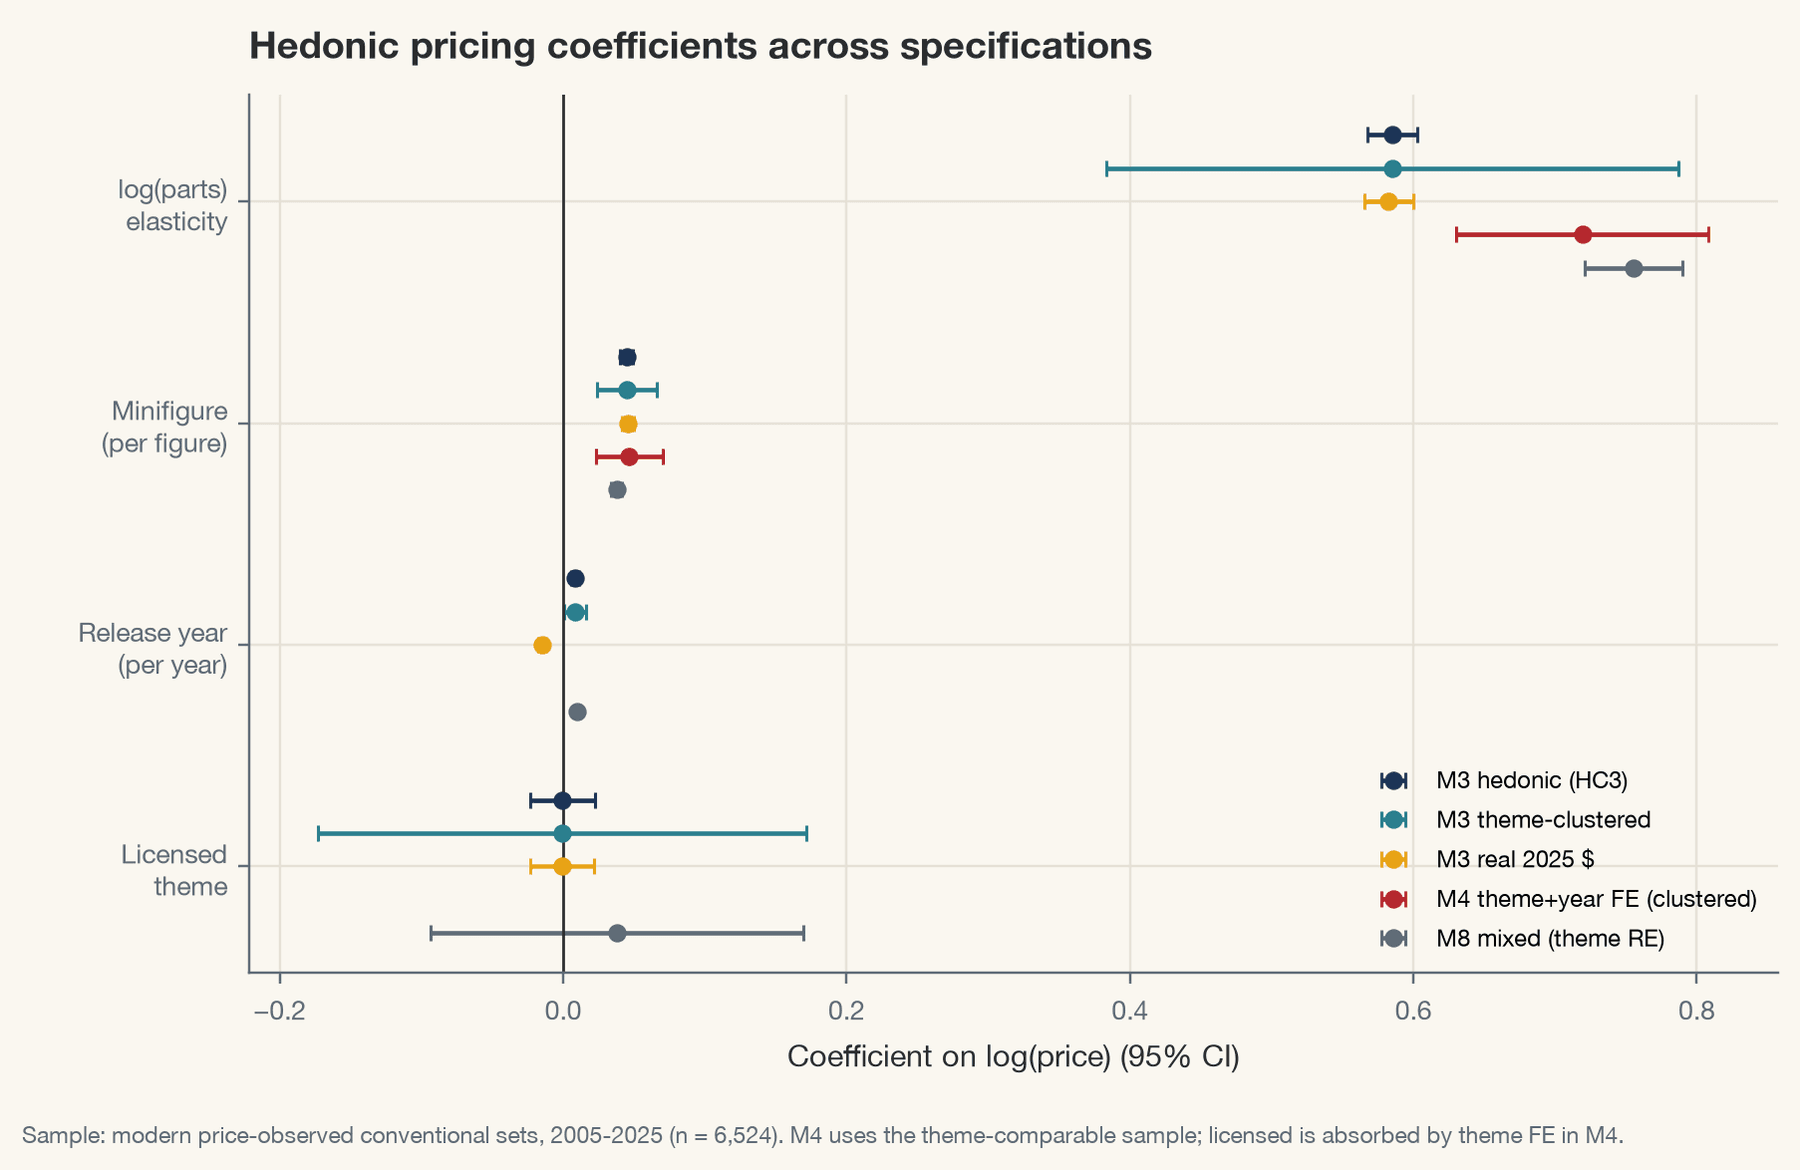
InterpretationElasticity, minifigure and year coefficients agree across OLS, clustered, real-price, fixed-effects and mixed models.
LimitationLicensing is absorbed by theme fixed effects and cannot be estimated there.
Interactive model · hedonic Model 4
What would this set cost?
Theme + year fixed effects · n = 5,974 sets
Estimated original US retail price
$56.45- 80% range
- $35.77 – $74.15
- Price per piece
- $0.14
- Theme contrast
- 0.0% vs City
A statistical estimate from the published regression, not an actual or official LEGO price. Doubling the pieces raises the estimate by about 65%, which is why larger sets look cheaper per piece.
Theme premiums
Theme fixed effects lift R² from 0.699 to 0.882. After Holm correction, 6 themes are priced significantly above City and 22 below. The extremes are about element format: Duplo is +300% (large bricks), DOTS -49%. Star Wars (-2.0%, CI -6.0% to 2.3%) is indistinguishable from City. Rankings are stable over time (Spearman ρ = 0.80 between 2005-2014 and 2015-2025).
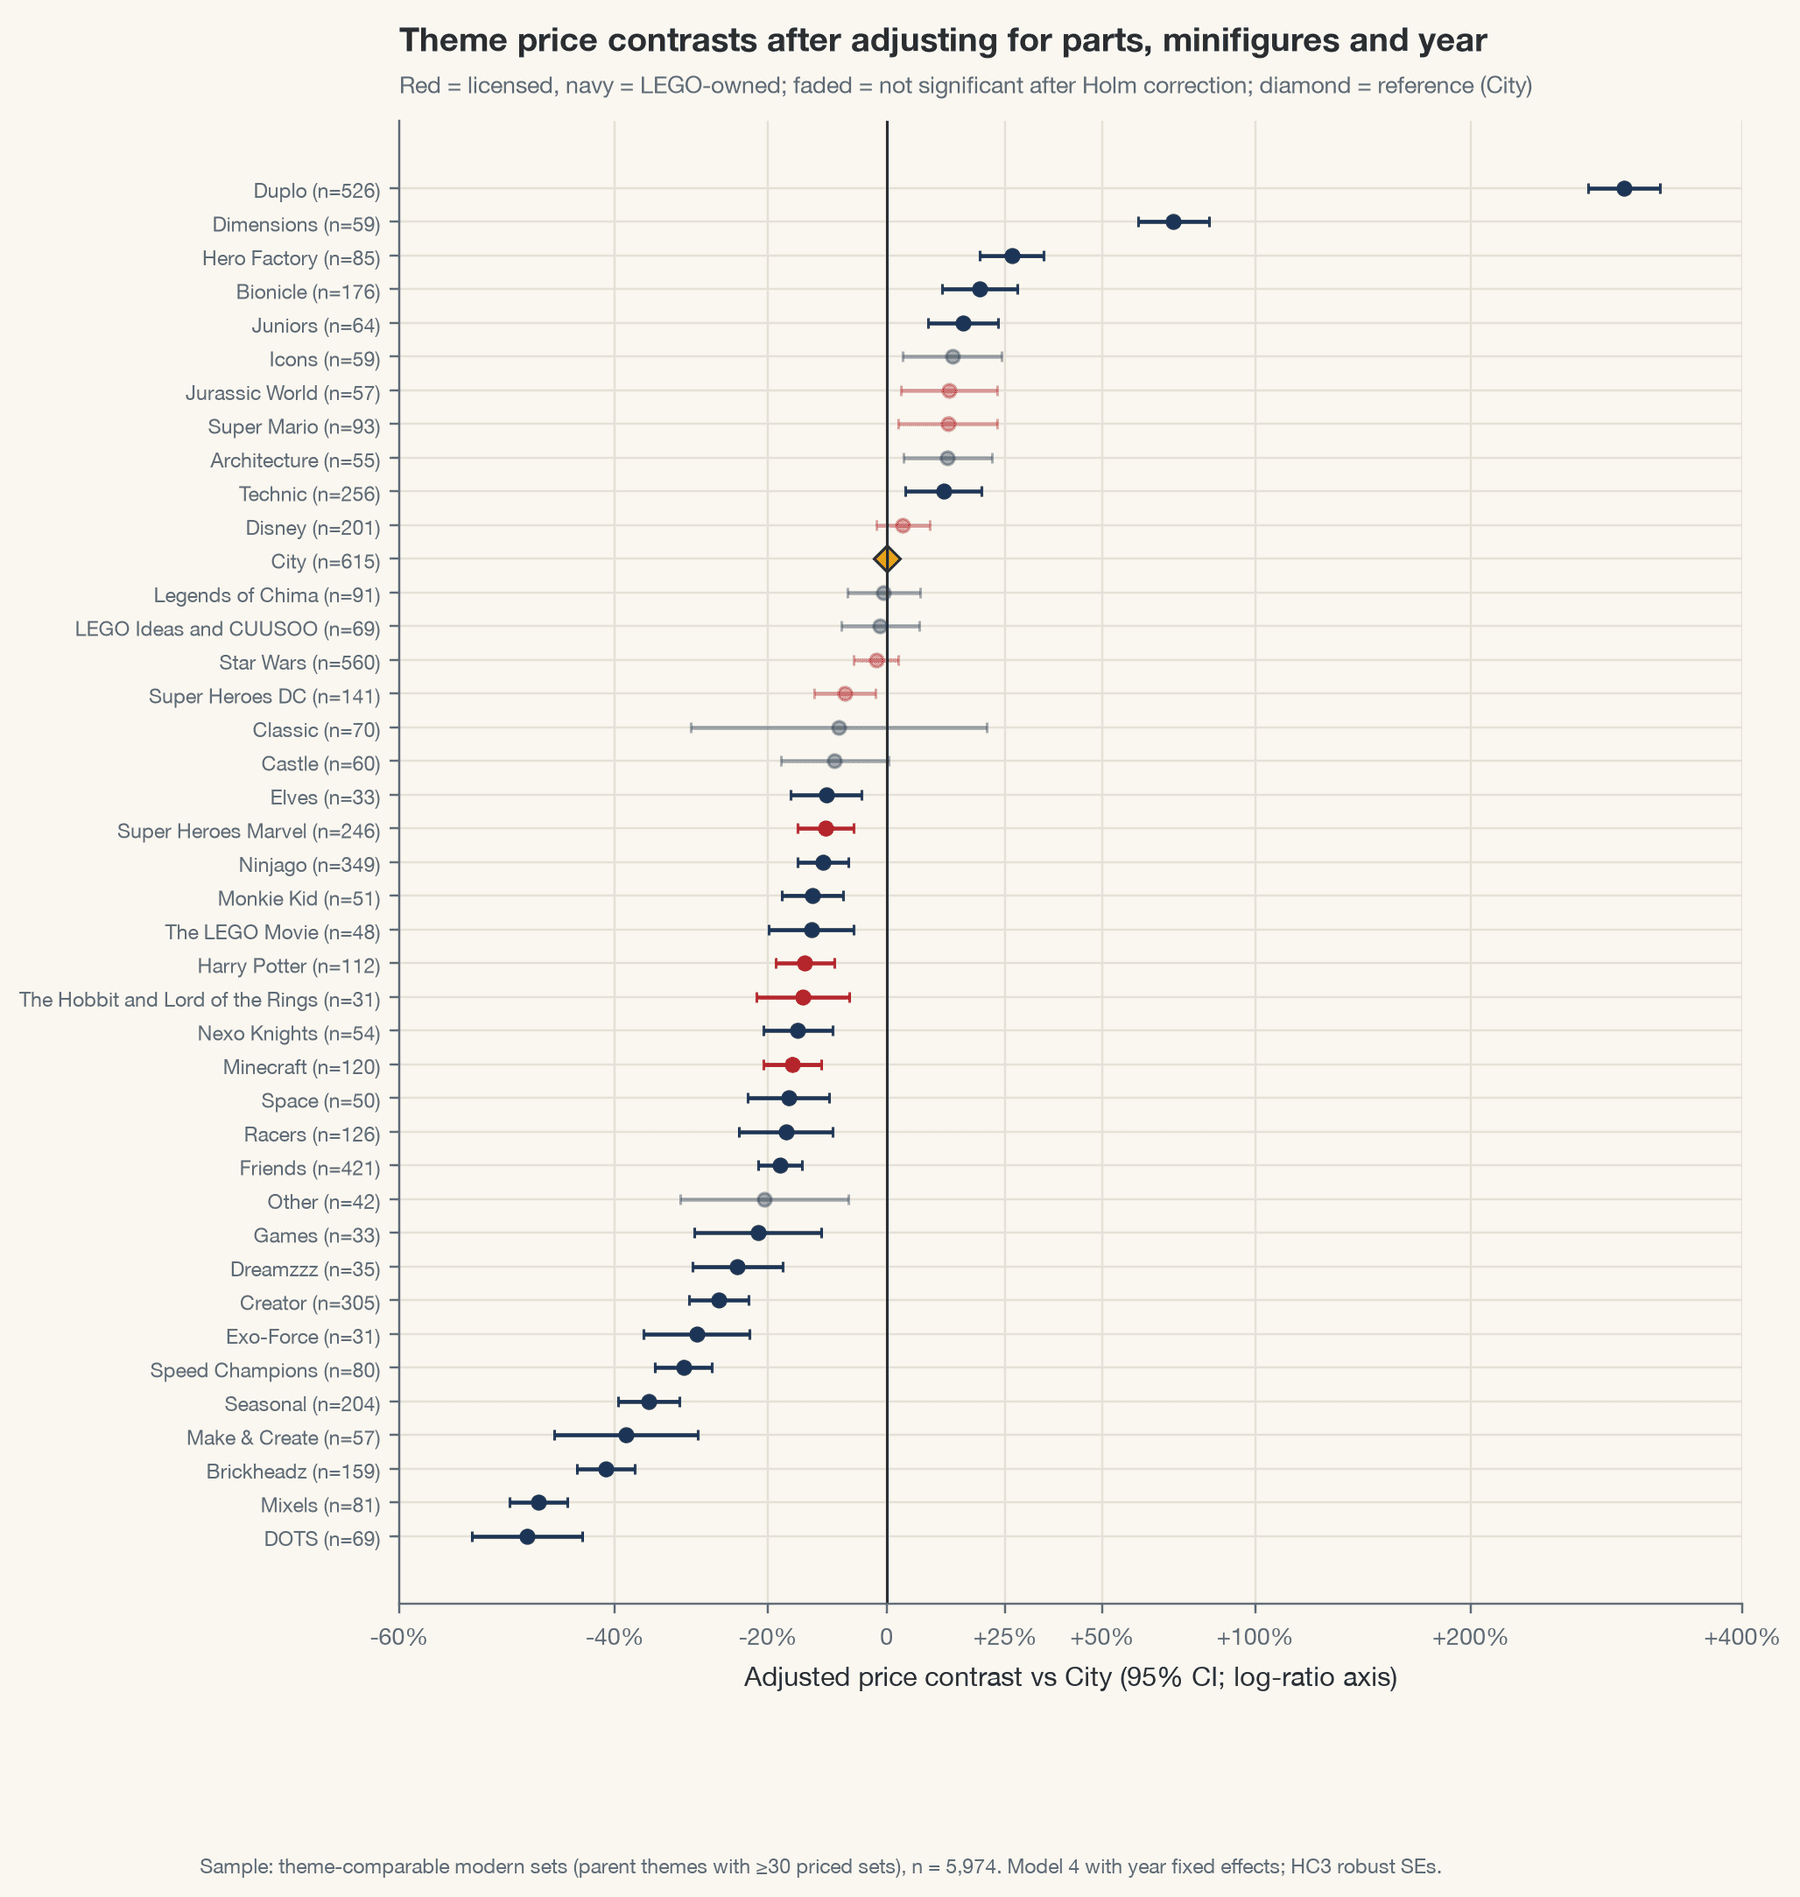
InterpretationLarge-element and collector themes sit at the top; small-format lines such as DOTS, Mixels and BrickHeadz at the bottom.
LimitationContrasts are conditional associations; licence fees, element mix and target age are unobserved.
Is there a licensed premium? With controls for parts, figures and year it is -0.0% (theme-clustered CI -15.9% to 18.8%). Controlling for Duplo-type formats moves it to +10.5% (CI 1.0% to 20.8%), and propensity matching gives +9.2%. The broad licence definition gives -6.5% and is not significant.
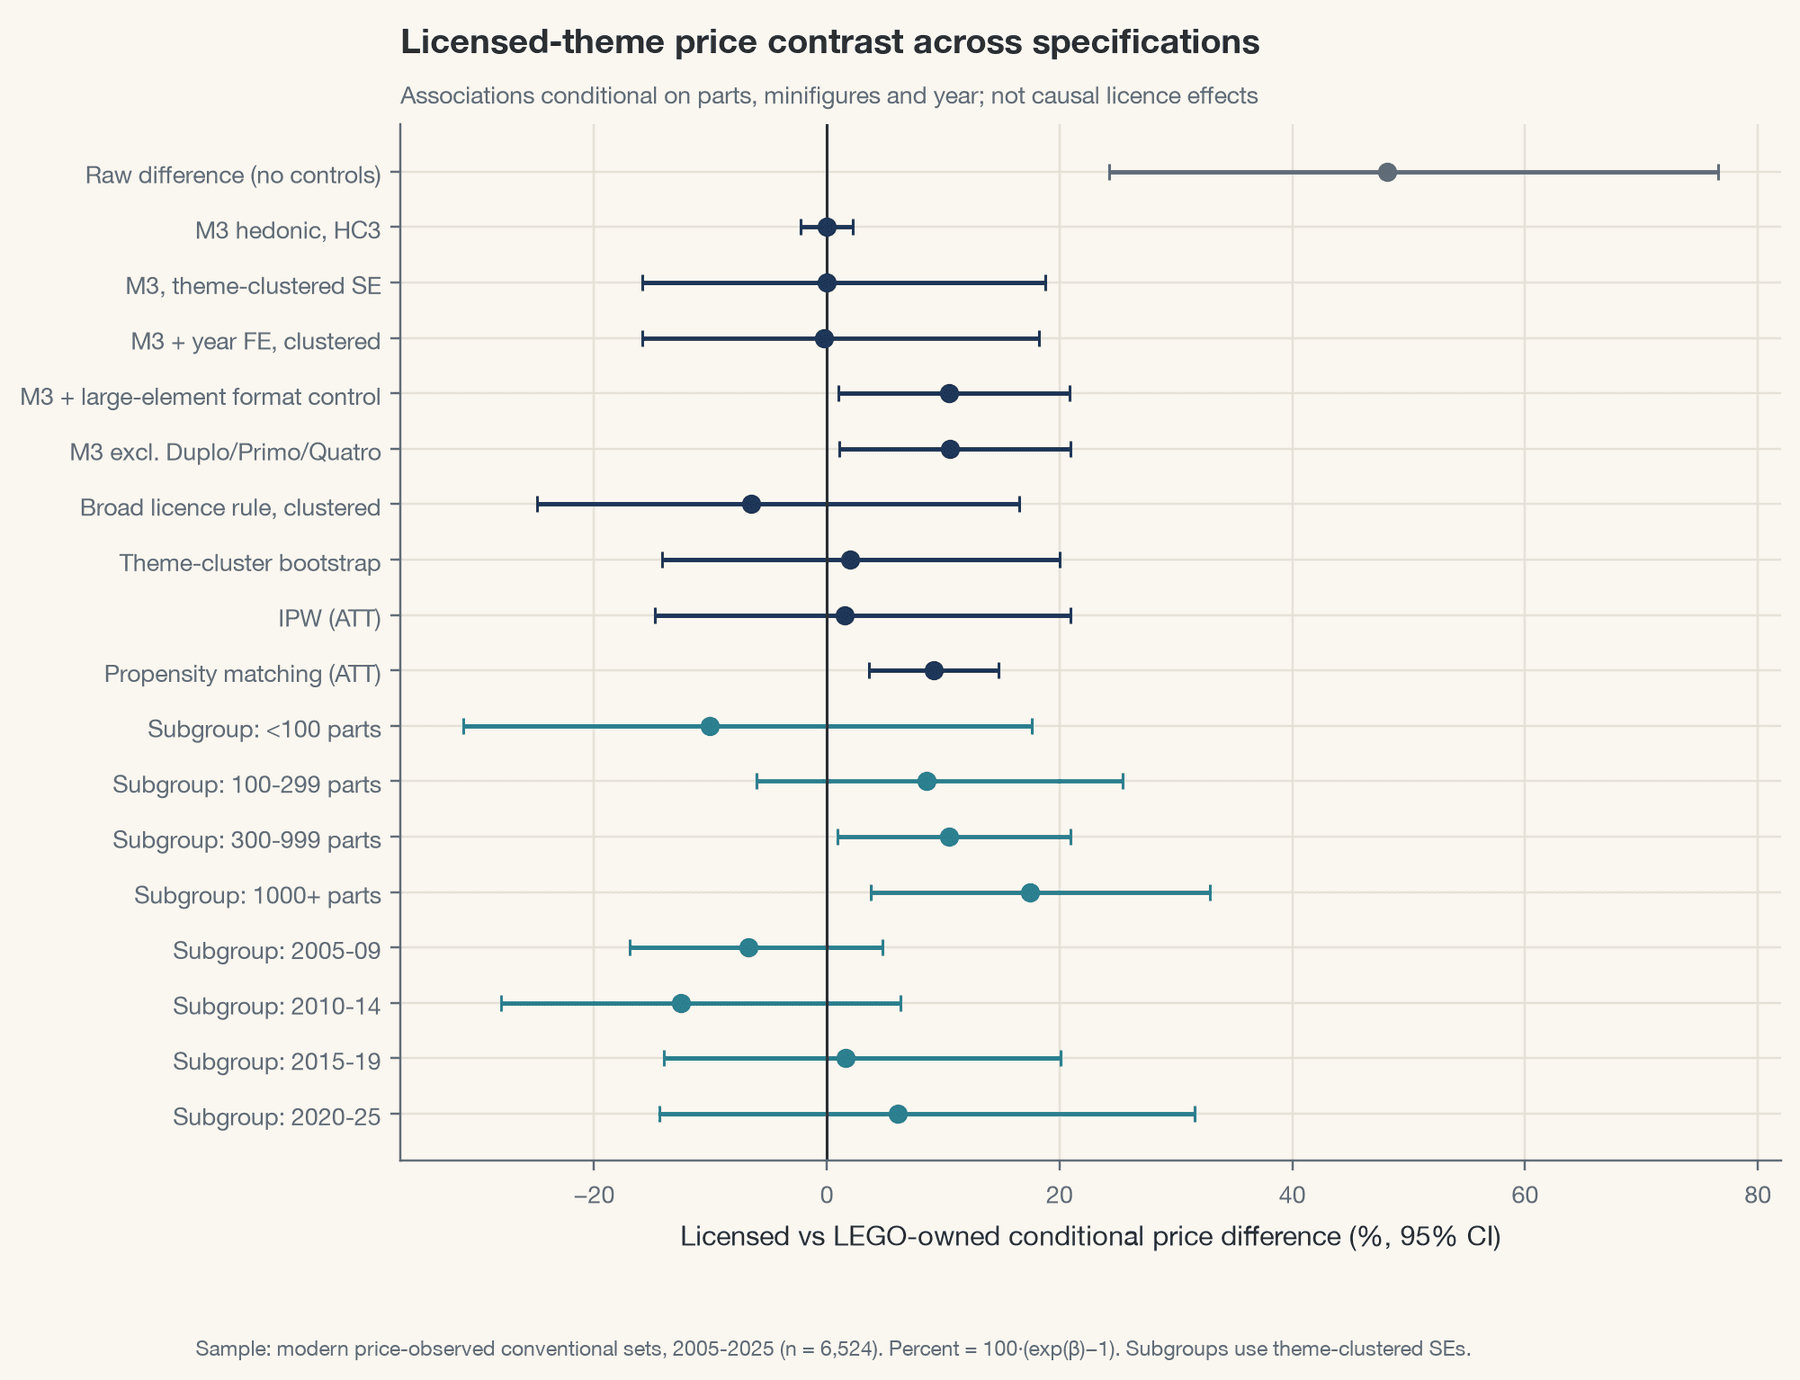
InterpretationA modest premium of about 10% appears for System sets once large-element formats are handled, concentrated in 1,000+ part sets.
LimitationSignificant in only 75% of robustness specifications; treat as fragile.
Minifigures
Each additional minifigure is associated with a 4.6% higher price (bootstrap CI 4.1% to 5.1%), slightly more in licensed themes (+1.97% extra per figure). The spline is concave: the first figures matter most. In the Kaggle minifigure table, 80.6% of figures appear in exactly one set.
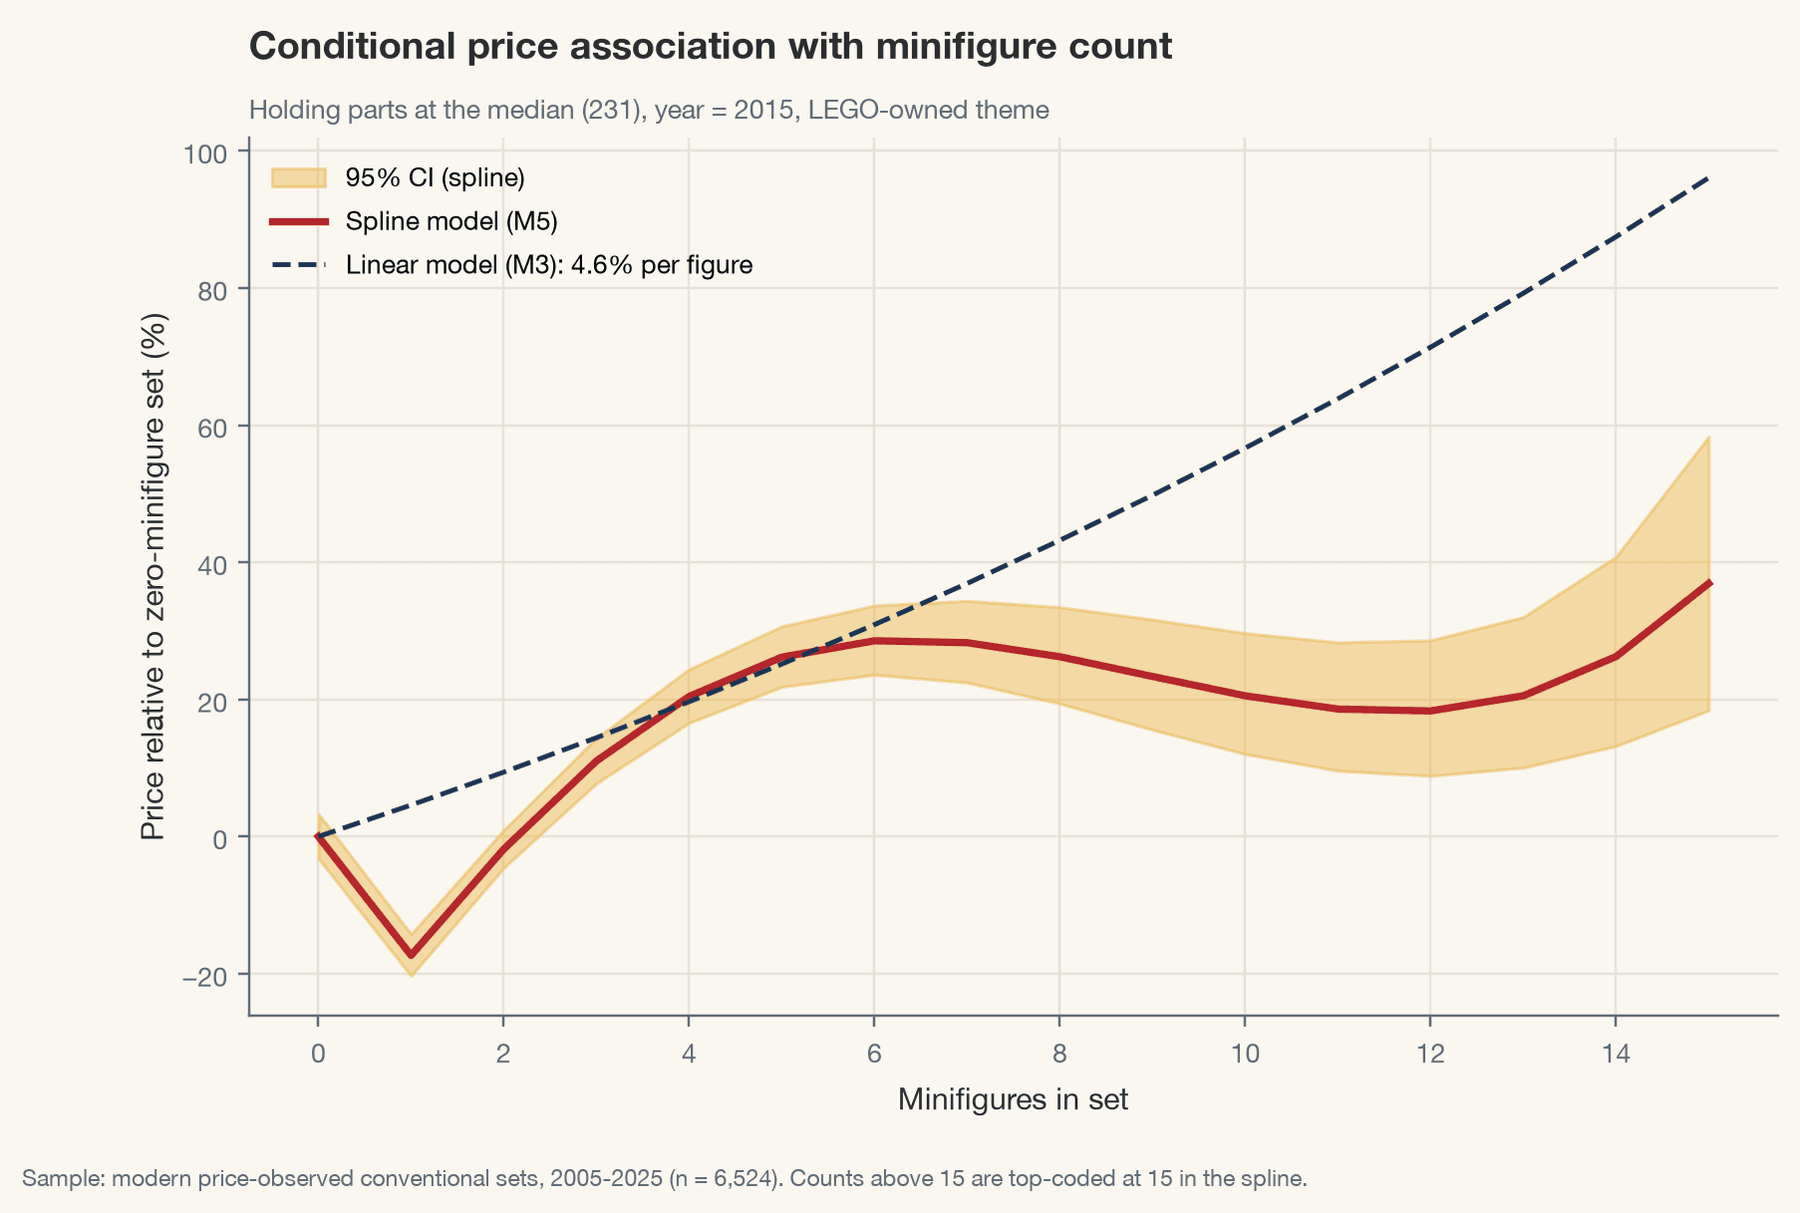
InterpretationIncrements shrink as figure counts rise, so the linear coefficient overstates large-cast sets.
LimitationMinifigure count is correlated with set size and theme; the curve holds those fixed only through the model.
Structural change
The price-size elasticity rose from 0.505 in 2005-2009 to about 0.602 after 2010 (Wald p < 0.001) and has been stable since. The sup-F test finds a break in 2022 (bootstrap p = 0.003), but the elasticity is unchanged (0.583 vs 0.584): recent years show a price-level shift, not a change in how size is priced.
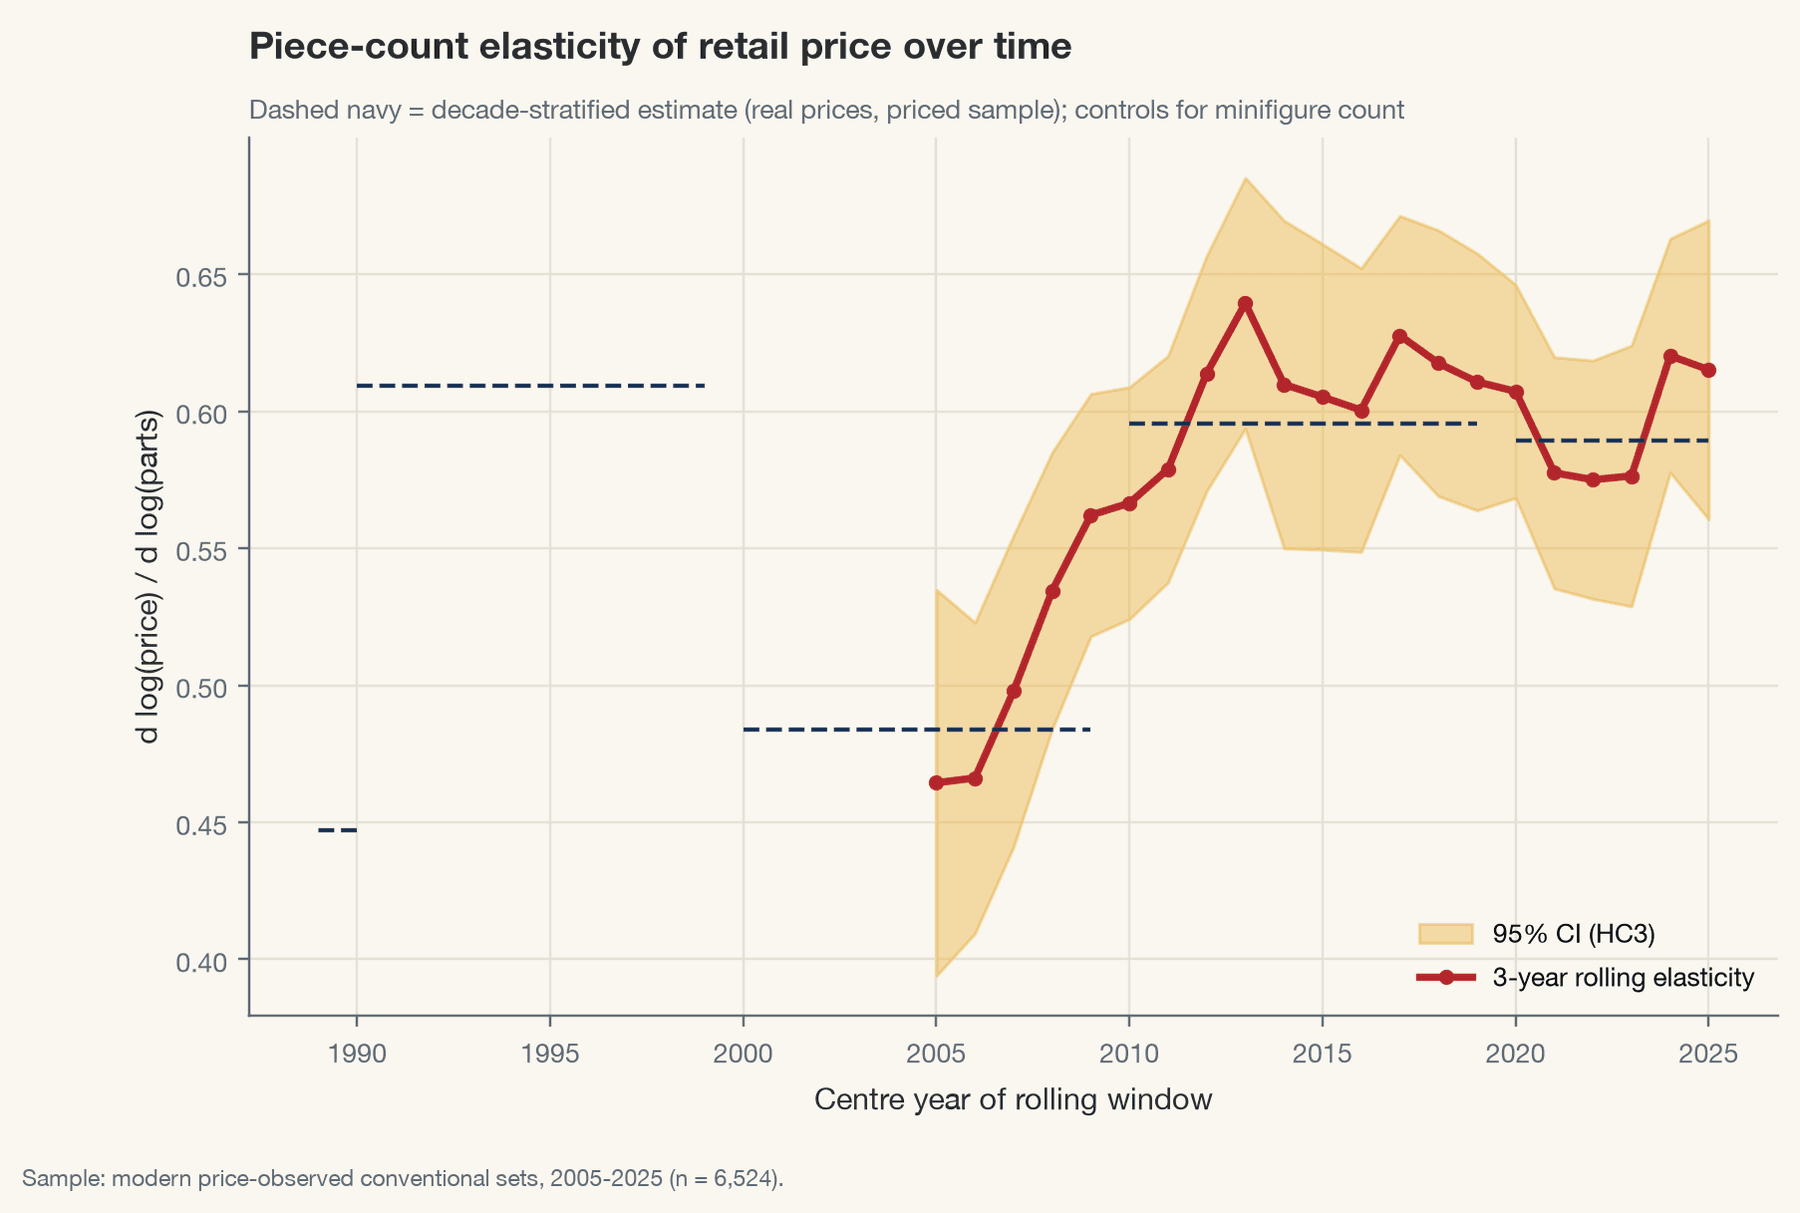
InterpretationThe gradient steepens around 2008-2011 and then holds steady.
LimitationThree-year windows trade noise for temporal resolution.
Machine learning
Twelve models were tuned with Optuna on training data only. Extra Trees is best on the group-disjoint random holdout (MAE $8.06, 95% CI $7.21-$9.03; R² 0.916) versus $10.72 for OLS. On the 2022-2025 temporal holdout, Random Forest leads with MAE $12.73. Differences among tree ensembles are within their intervals.
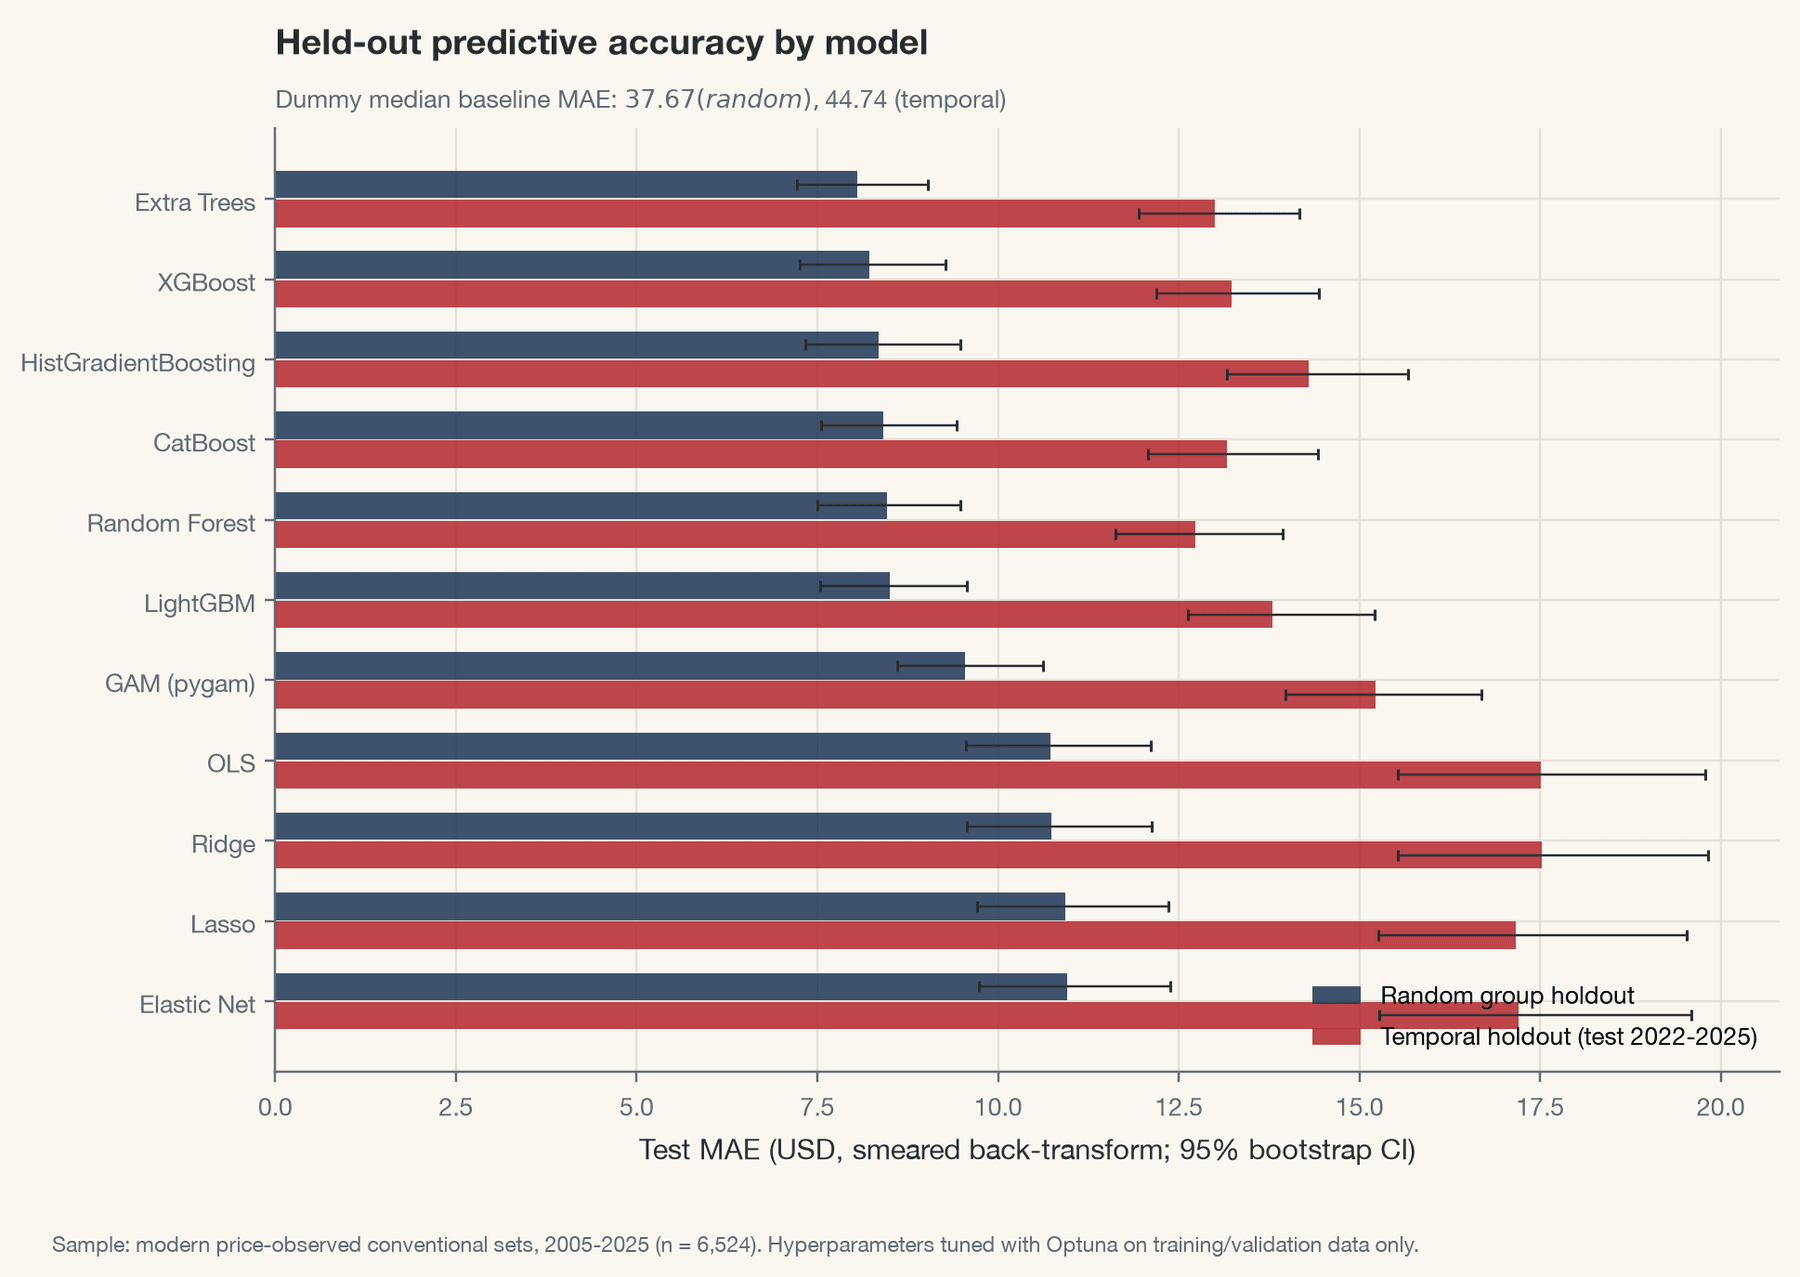
InterpretationTree ensembles beat linear hedonic models by roughly a quarter in dollar error, in both designs.
LimitationTemporal errors are larger because recent sets are larger and pricier.
Ablations answer what information matters. Adding theme to pieces and year cuts OLS error by 32% and LightGBM error by 32%. Removing minifigures from the full LightGBM model raises error by only 3.9%.
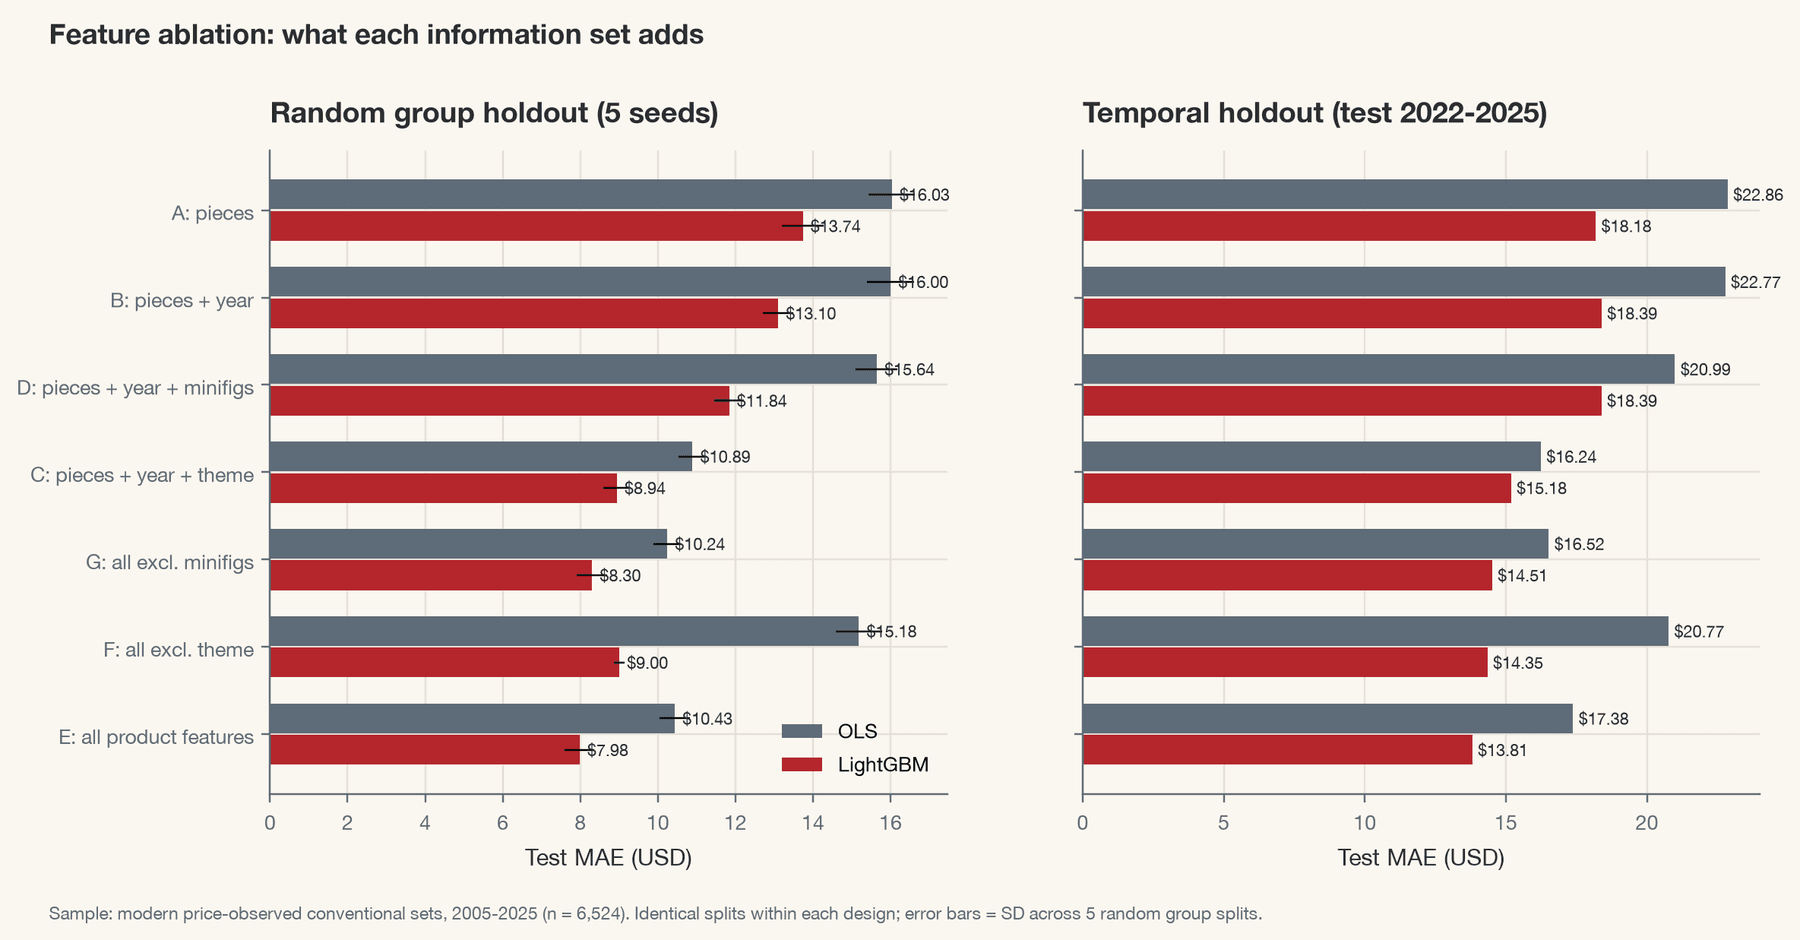
InterpretationSize first, theme second; minifigures and year add little predictive value once those are known.
LimitationFive random group splits; temporal ablation uses one fixed split.
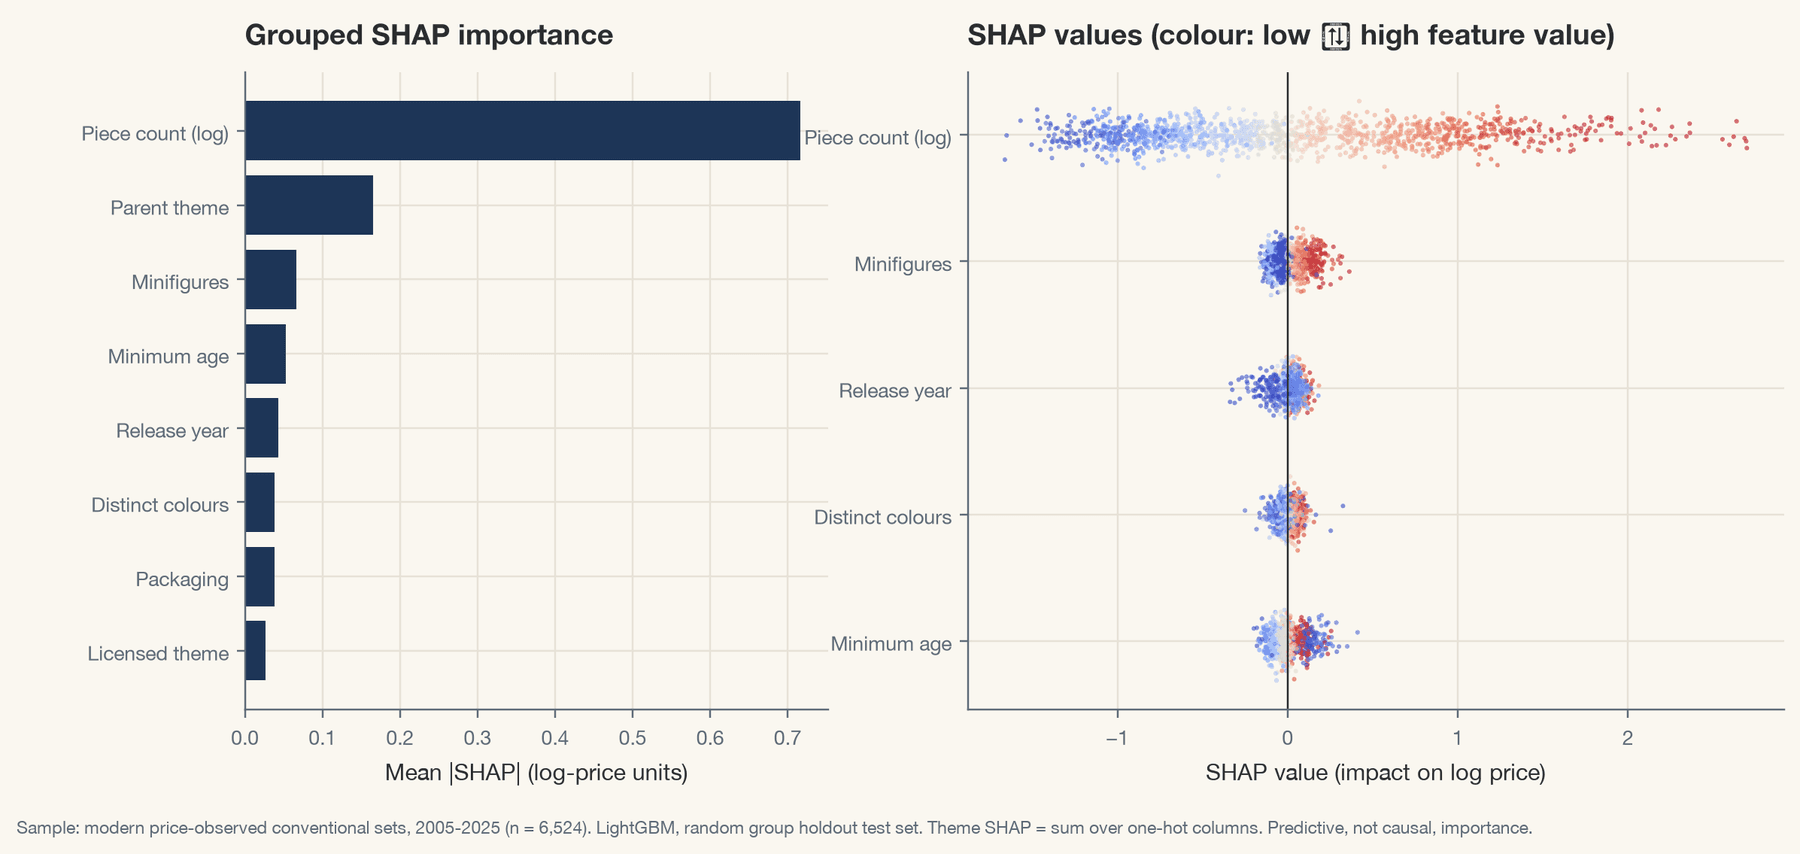
InterpretationPiece count carries 62% of mean absolute attribution and theme 14%.
LimitationPredictive attribution, not causal importance; correlated features share credit.
Robustness
Key pricing estimates were re-run under 16 specifications: real prices, alternative errors, size trims, recent-decade and theme-comparable samples, archive-only prices, Brickset piece counts, nonstandard products, year fixed effects, a broad licence rule and inverse-probability weights for missing prices.
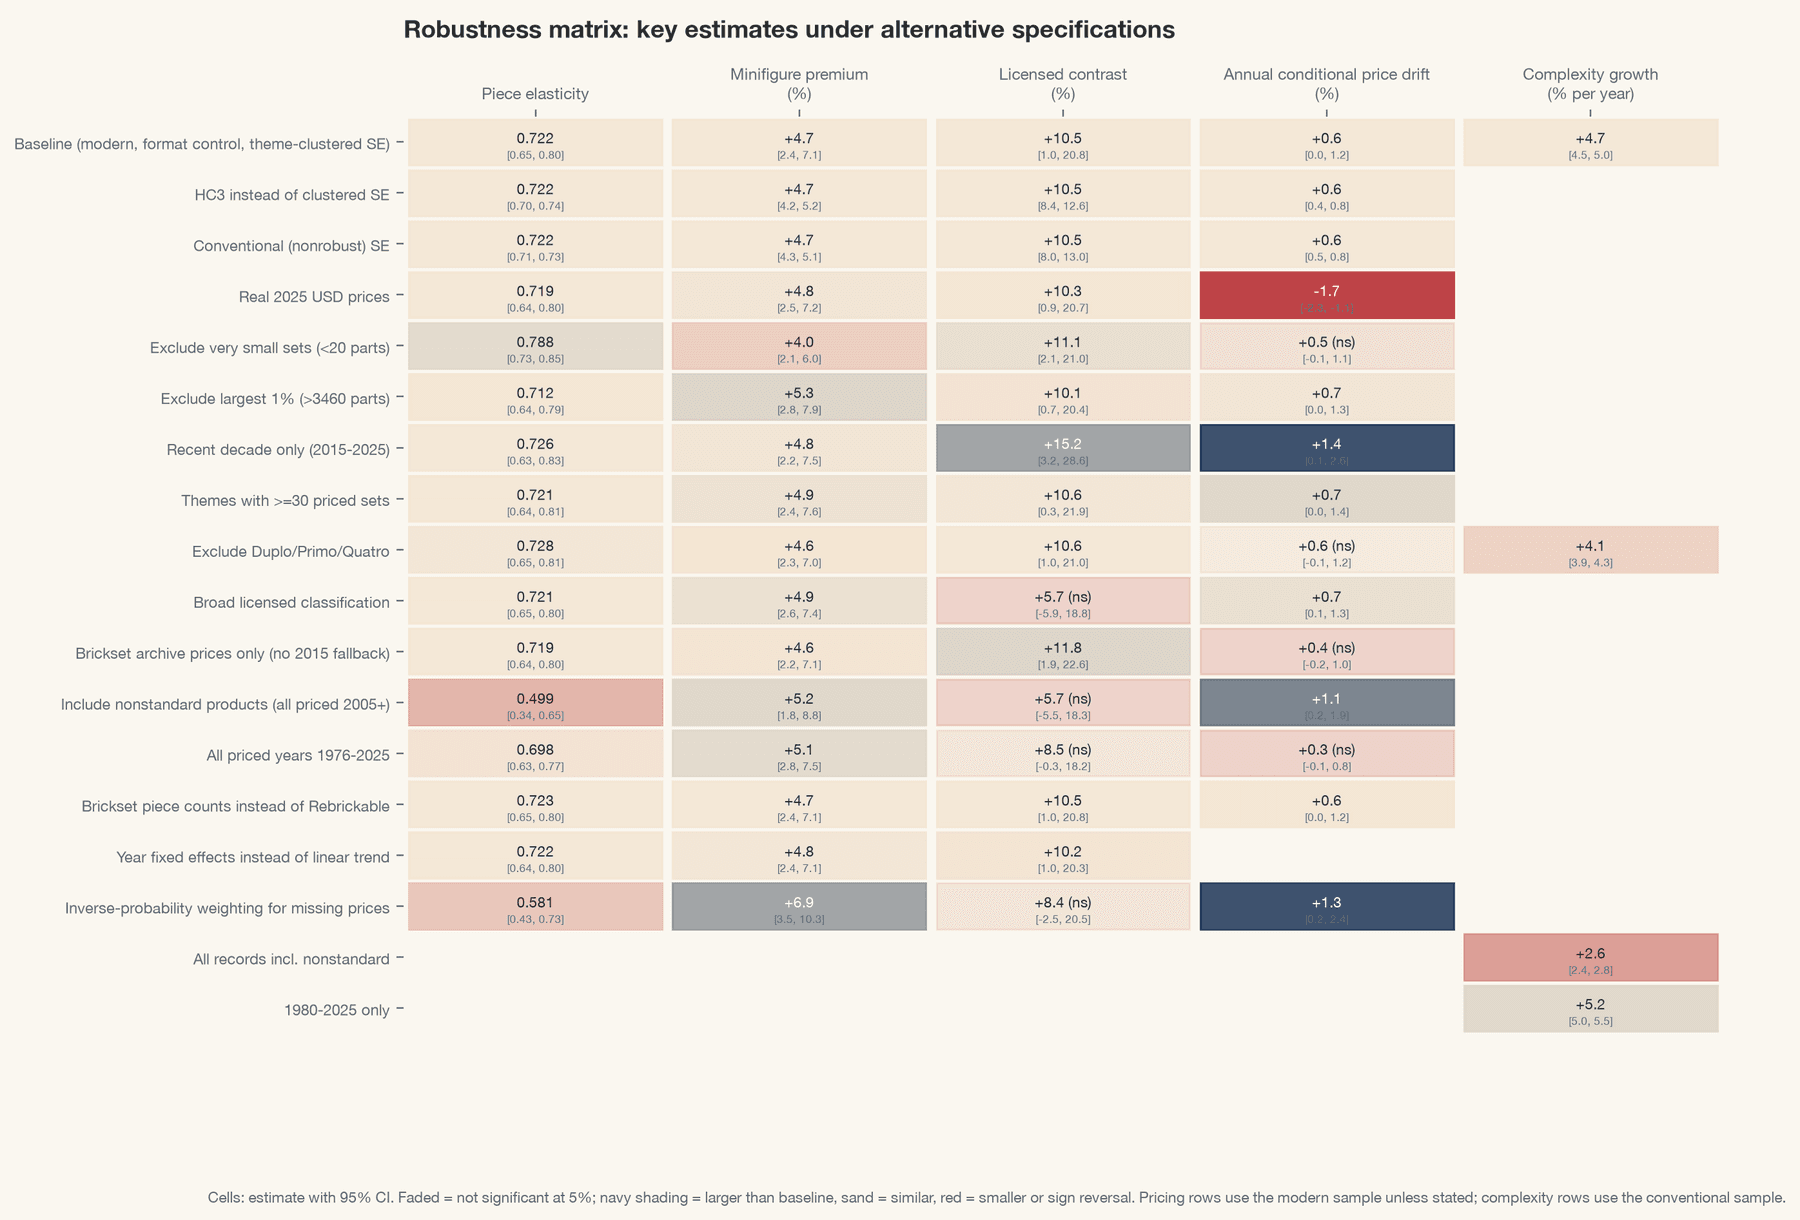
InterpretationElasticity stays between 0.50 and 0.79; minifigure and complexity findings hold in every specification; real conditional prices fall.
LimitationWith the format control the licensed contrast stays positive (5.7% to 15.2%) but loses significance in 25% of specifications; without it the estimate is near zero.
Limitations
Conclusion
Observable characteristics explain most LEGO price variation: piece count alone explains 69% of log-price variance, theme fixed effects bring the hedonic model to 88%, and the best model reaches held-out R² 0.916. LEGO's schedule is stable and sub-proportional in size, with persistent theme-segment offsets. Sets grew, nominal prices rose, and real prices for comparable content fell.
References
- [1]
Hacinacar, A. H. (2025). LEGO Sets, Themes, and Minifigures (1975-2025). Kaggle dataset. Source
- [2]
Bryer, J. (2026). brickset: Interface with the Brickset API (legosets data). R package, GitHub. Source
- [3]
Kross, S. (2015). lego: LEGO sets data from Brickset. R package, GitHub. Source
- [4]
U.S. Bureau of Labor Statistics (2026). CPI for All Urban Consumers (CPIAUCSL). FRED, Federal Reserve Bank of St. Louis. Source
- [5]
Rosen, S. (1974). Hedonic prices and implicit markets: Product differentiation in pure competition. Journal of Political Economy, 82(1), 34-55. Source
- [6]
Duan, N. (1983). Smearing estimate: A nonparametric retransformation method. Journal of the American Statistical Association, 78(383), 605-610. Source
- [7]
Hansen, B. E. (2000). Testing for structural change in conditional models. Journal of Econometrics, 97(1), 93-115. Source
- [8]
Lundberg, S., & Lee, S.-I. (2017). A unified approach to interpreting model predictions. NeurIPS 30. Source
Complete paper
The complete 58-page paper contains the full methods, 13 tables, all 43 figures, references, appendices and reproducibility notes. Its author line and PDF metadata identify Akshay Byagathvalli.