Akshay Byagathvalli links Small Arms Survey estimates of civilian firearms per 100 residents (2017) to UNODC firearm homicide rates averaged over 2013-2022 for 96 countries, adds World Bank development indicators, Worldwide Governance Indicators and UCDP conflict data, and asks how much of the cross-national variation in gun killing firearm prevalence explains once regional, socioeconomic and institutional conditions are considered. Every number below is read from the pipeline's saved results. All findings are country-level associations, not causal effects.
Research question
To what extent is civilian firearm ownership associated with firearm-related homicide rates across countries, and how much additional variation can be explained by socioeconomic, demographic, geographic, and institutional characteristics? Six hypotheses cover the conditional association (H1), socioeconomic adjustment (H2), regional heterogeneity (H3), nonlinearity (H4), incremental predictive value (H5) and spatial dependence (H6). No direction was assumed.
Dataset
The Kaggle Global Gun Violence and Civilian Firearms collection supplies SAS firearm estimates for 230 locations, a 187-country UNODC/World Bank panel (2000-2024) and a long-run European homicide file. Firearms per 100 residents is an estimated stock, not the share of people who own a gun; the United States' 120.5 means more guns than people. Firearm homicide is reported by only 96 countries, mostly in Europe and Latin America, so the results describe reporting countries rather than the world.
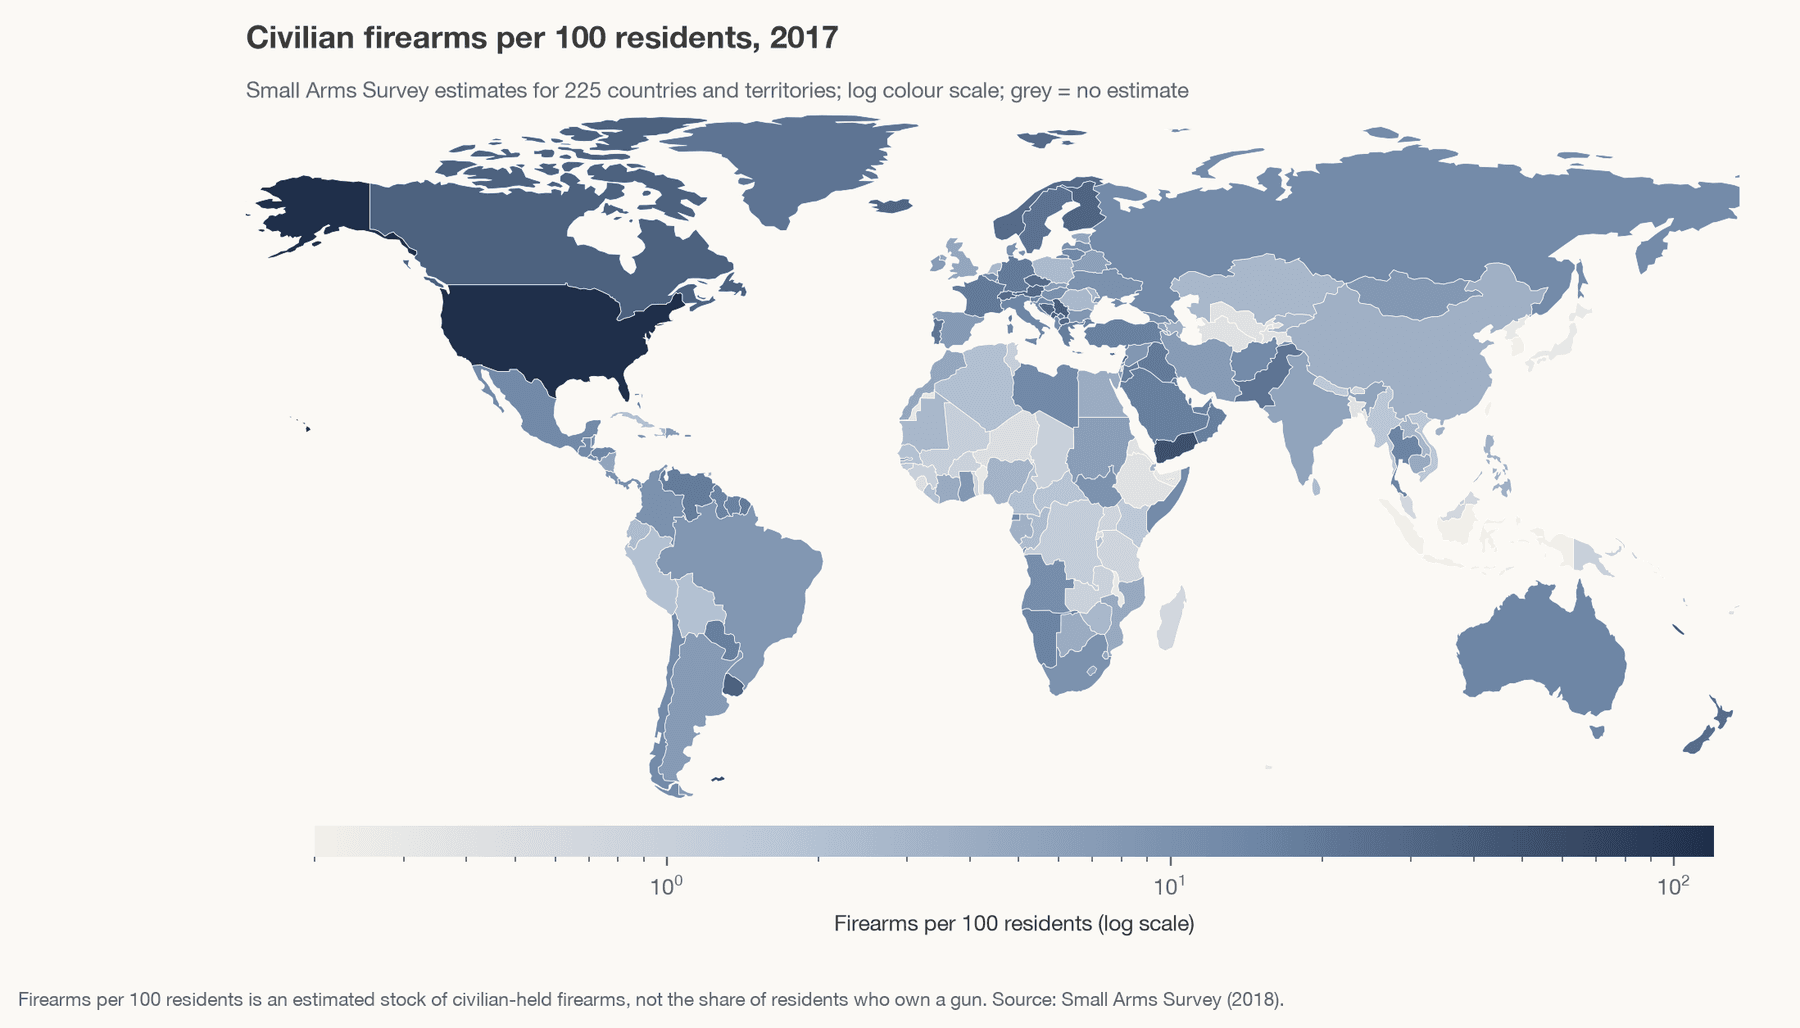
InterpretationThe United States is an extreme outlier; most of Africa and Asia hold fewer than 5 per 100.
LimitationSAS estimates mix surveys, expert judgement and analogous comparison.
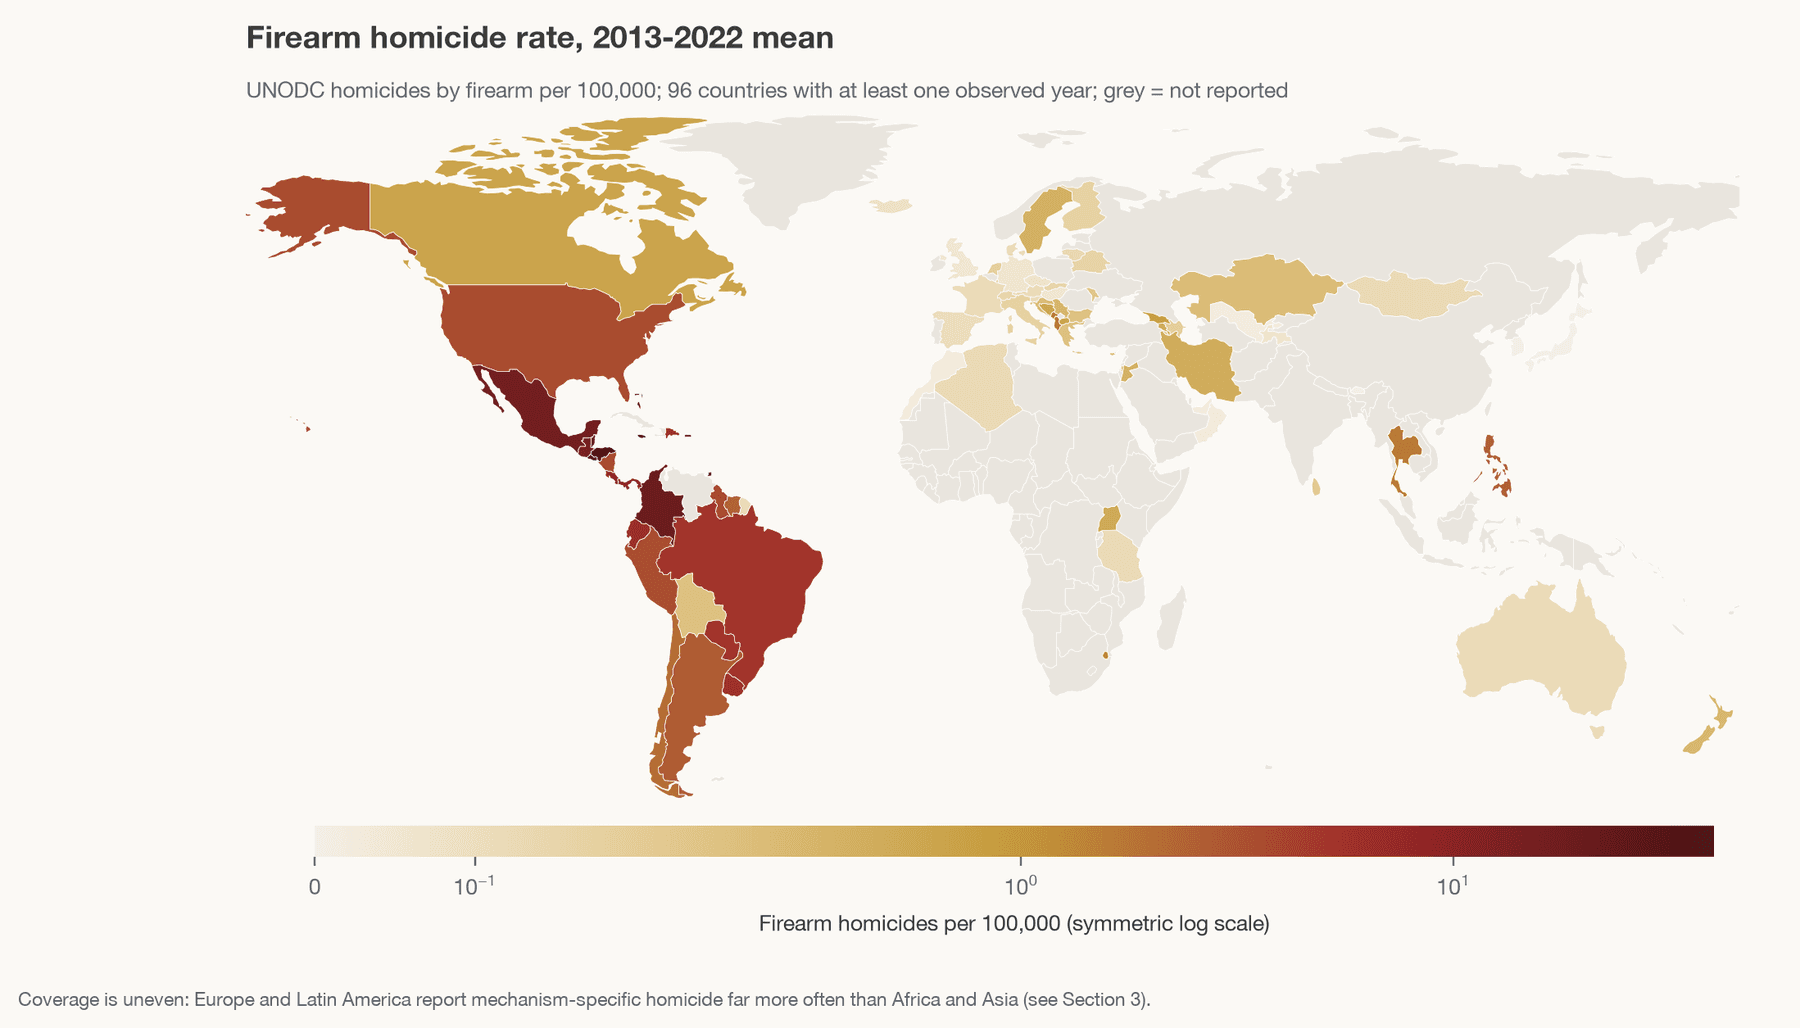
InterpretationLatin America and the Caribbean stand far above every other region.
LimitationGrey countries do not report homicide by mechanism.
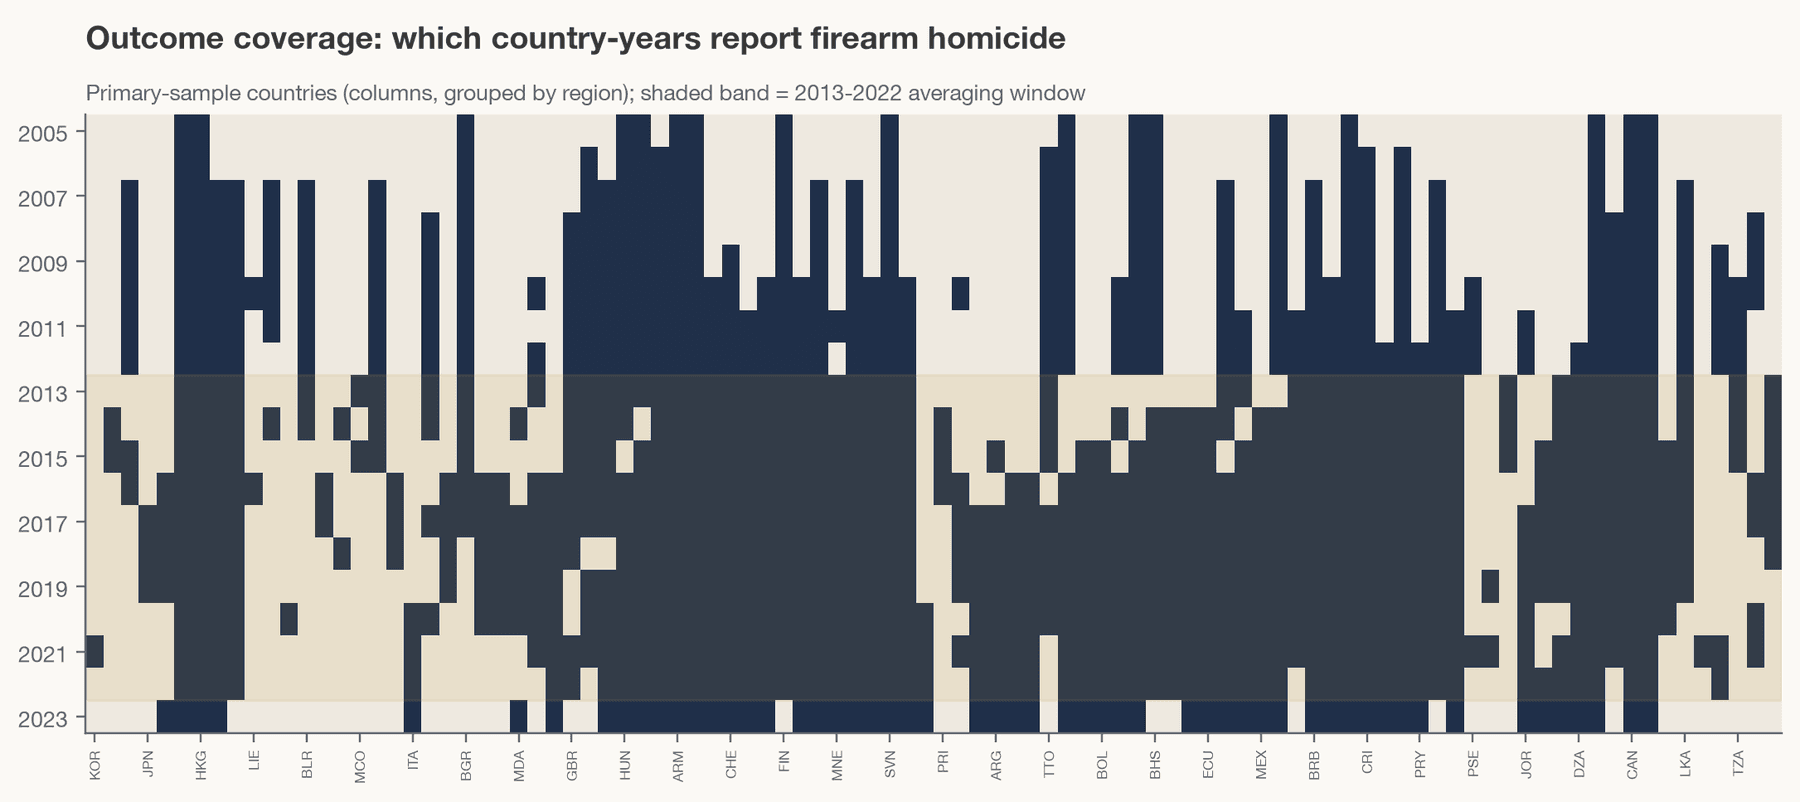
InterpretationThe median country has 8 observed years in the window.
LimitationAfrica and South Asia are almost absent.
Methodology
Ownership enters per 10 firearms per 100 residents. Models 1-5 add socioeconomic controls (log GDP, urbanisation, unemployment, males 15-64), World Bank region effects and a governance index (first principal component of four WGI estimates) on the log(1 + rate) and rate scales with HC3 errors. Models 6-12 test interactions, splines and a GAM, quantile regression, population weights, regional random effects, a negative binomial count model with person-year offsets and a country-year panel. Fourteen learners are compared with nested 5x5 cross-validation, a leave-one-region-out stress test and eight feature-group ablations on identical folds. Spatial dependence uses Moran's I and LISA under four weight definitions.
Descriptive results
The raw cross-national association is flat: Pearson r = -0.09, Spearman ρ = 0.01. All twenty highest firearm homicide rates are in Latin America and the Caribbean, whose firearm stocks are moderate, while high-ownership countries such as Serbia, Montenegro, Finland and Switzerland record low rates.
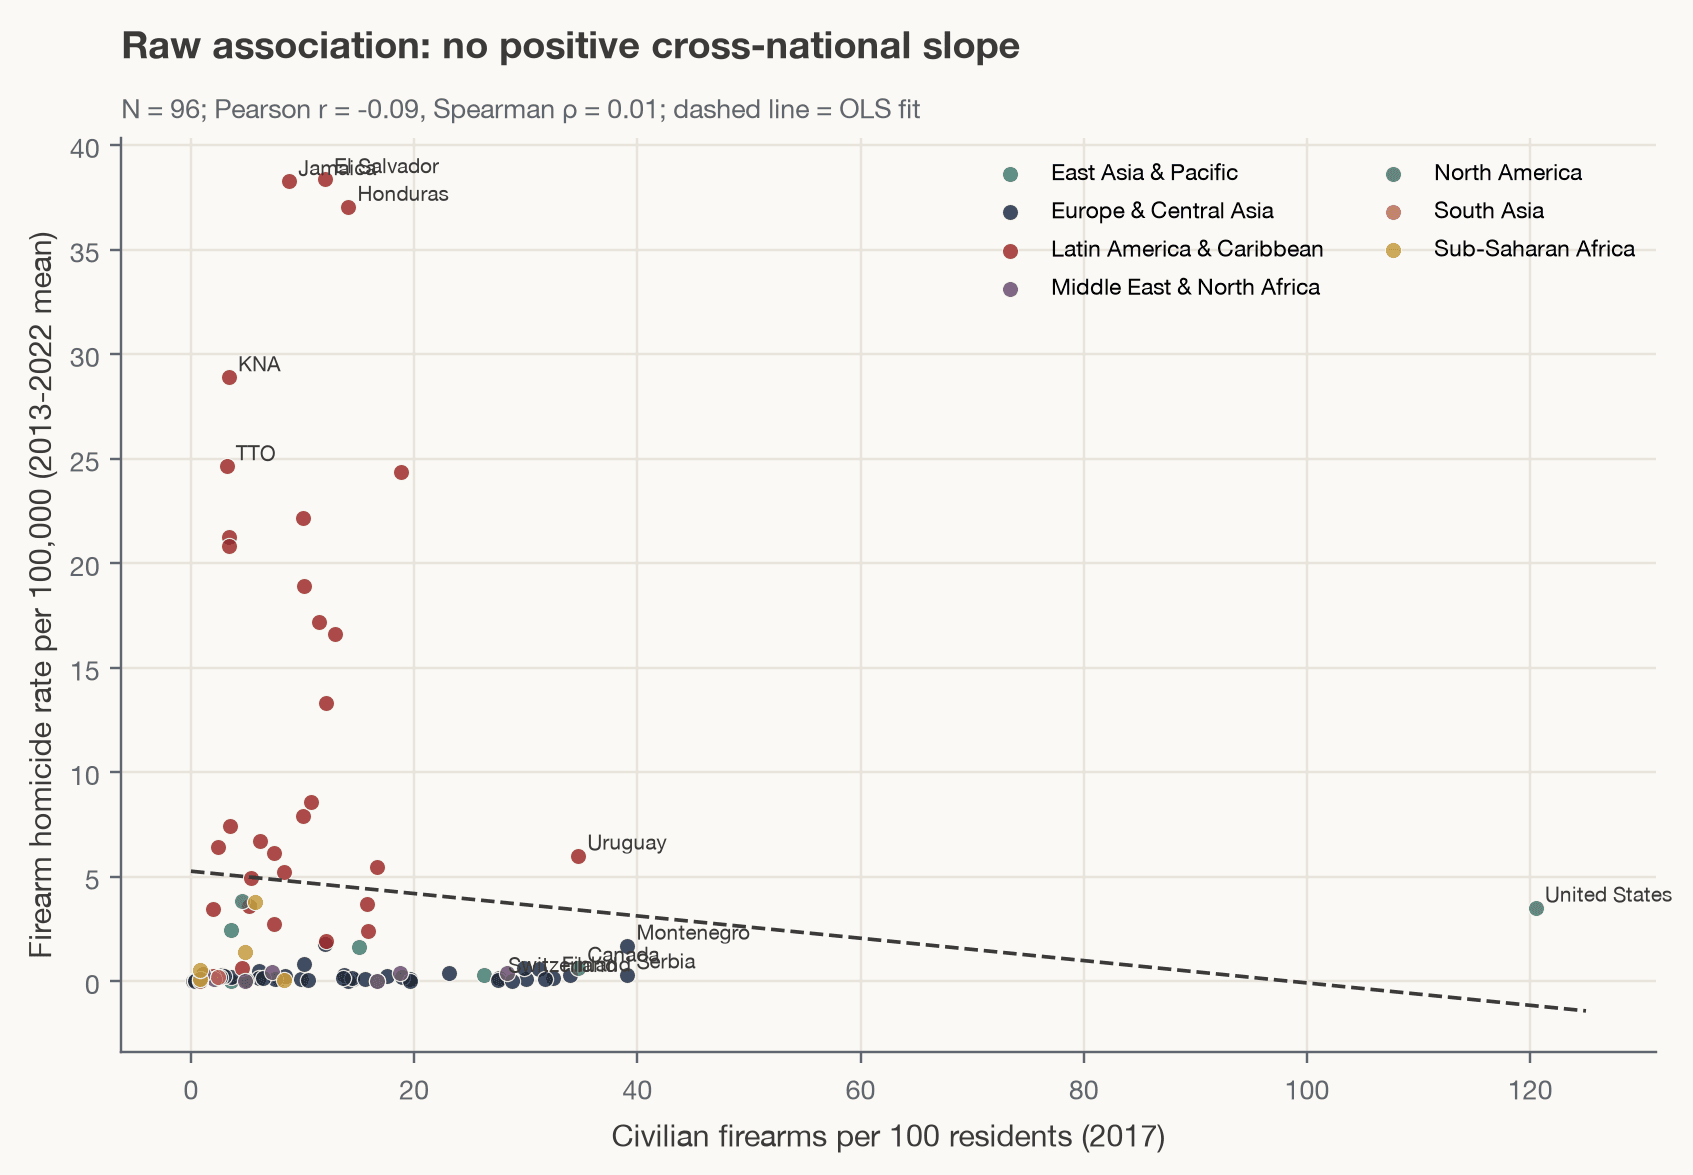
InterpretationNo positive global slope; the United States sits far to the right with a mid-range rate.
LimitationUnadjusted; regions differ greatly in homicide levels.
Outside Latin America and the Caribbean the picture changes: among high-income countries in other regions the correlation is 0.52 (p < 0.001, n = 37), echoing earlier high-income comparisons.
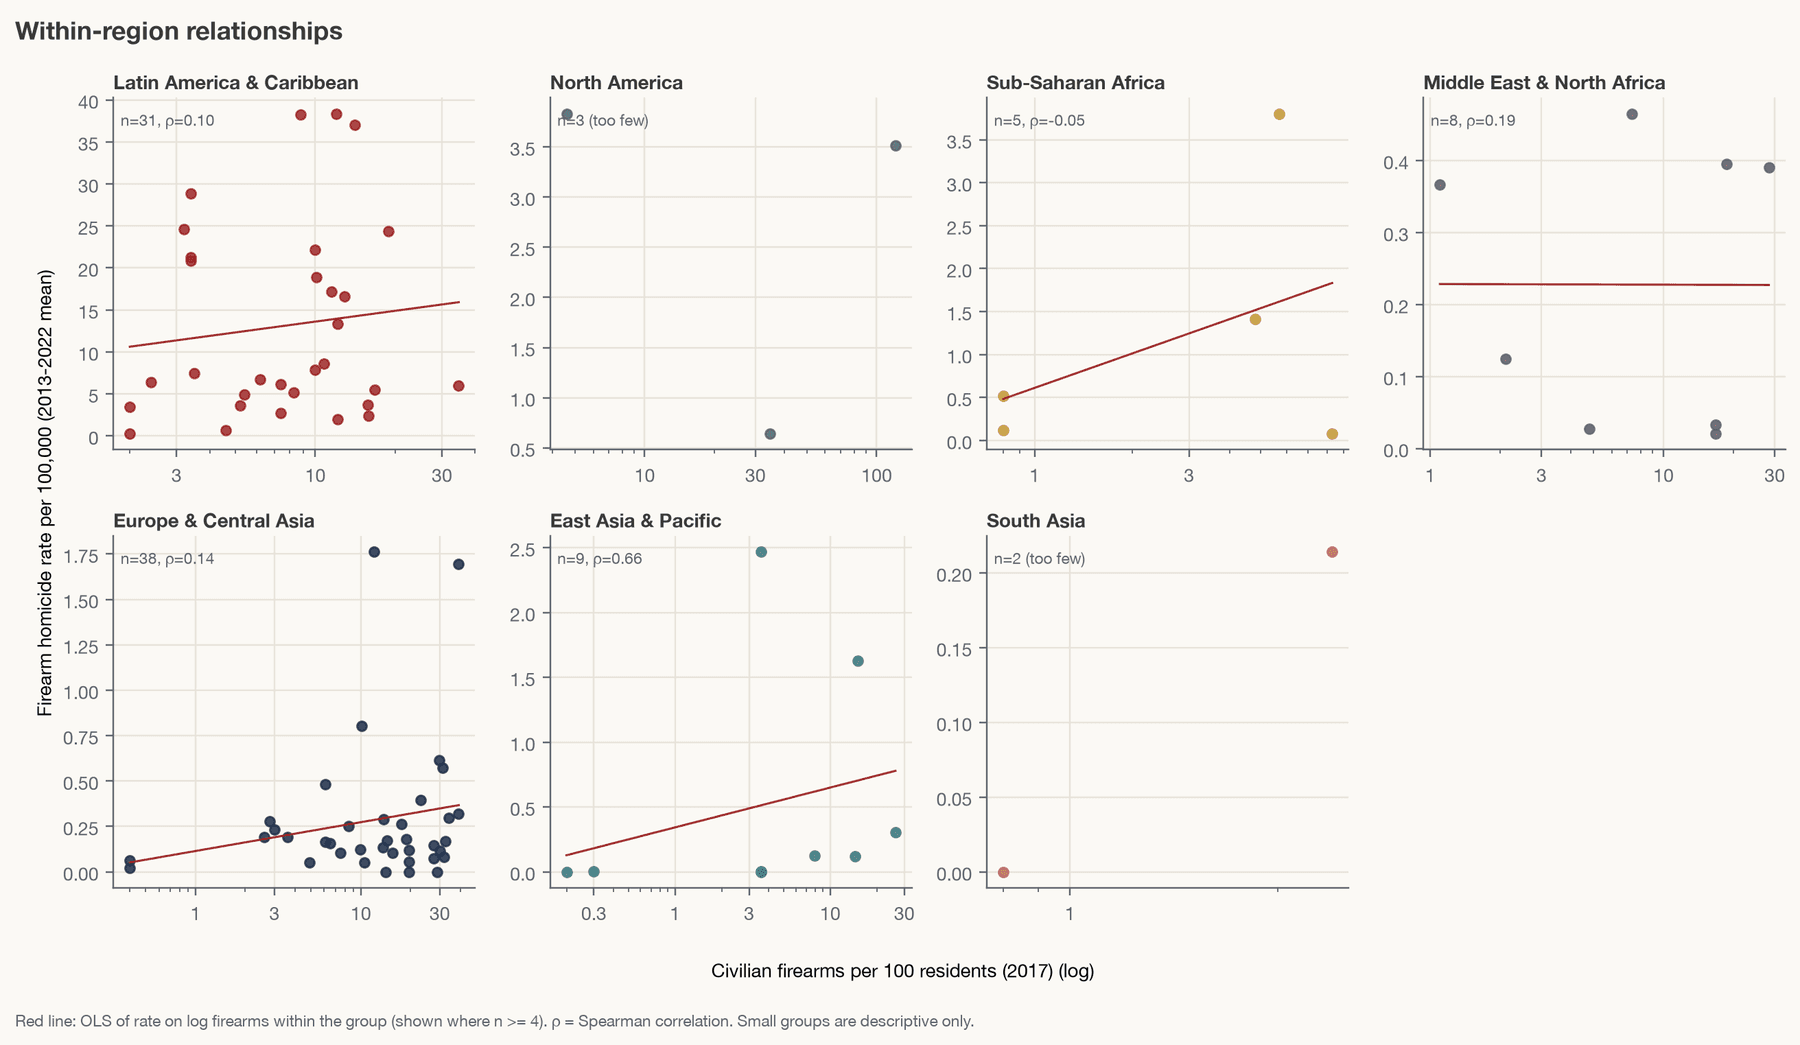
InterpretationWithin regions the slopes are mostly positive but shallow and imprecise.
LimitationSeveral regions have fewer than ten countries.
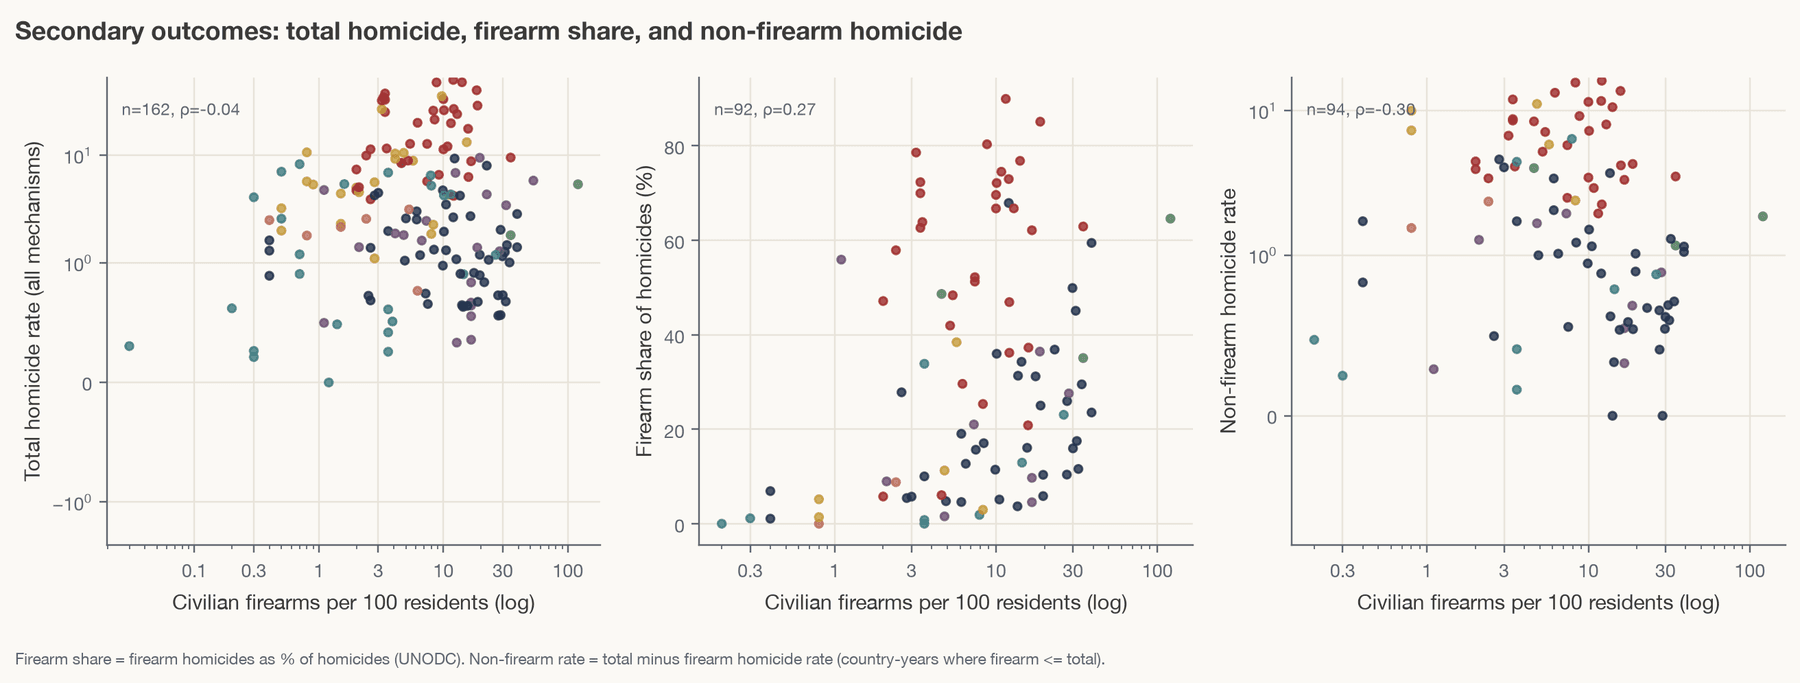
InterpretationMore guns go with a larger firearm share of killings, not with more killings overall.
LimitationCompatible with substitution and with reporting differences; neither is identified.
Econometric results
Socioeconomic controls barely move the ownership coefficient; region effects do. In Model 5, +10 firearms per 100 is associated with 9.5% higher (1 + firearm homicide rate) (95% CI 1.2% to 18.5%, p = 0.024). The negative binomial rate ratio is 1.32 (1.13-1.53). On the untransformed scale the estimate is +0.28 per 100,000 (CI -0.51 to +1.08).
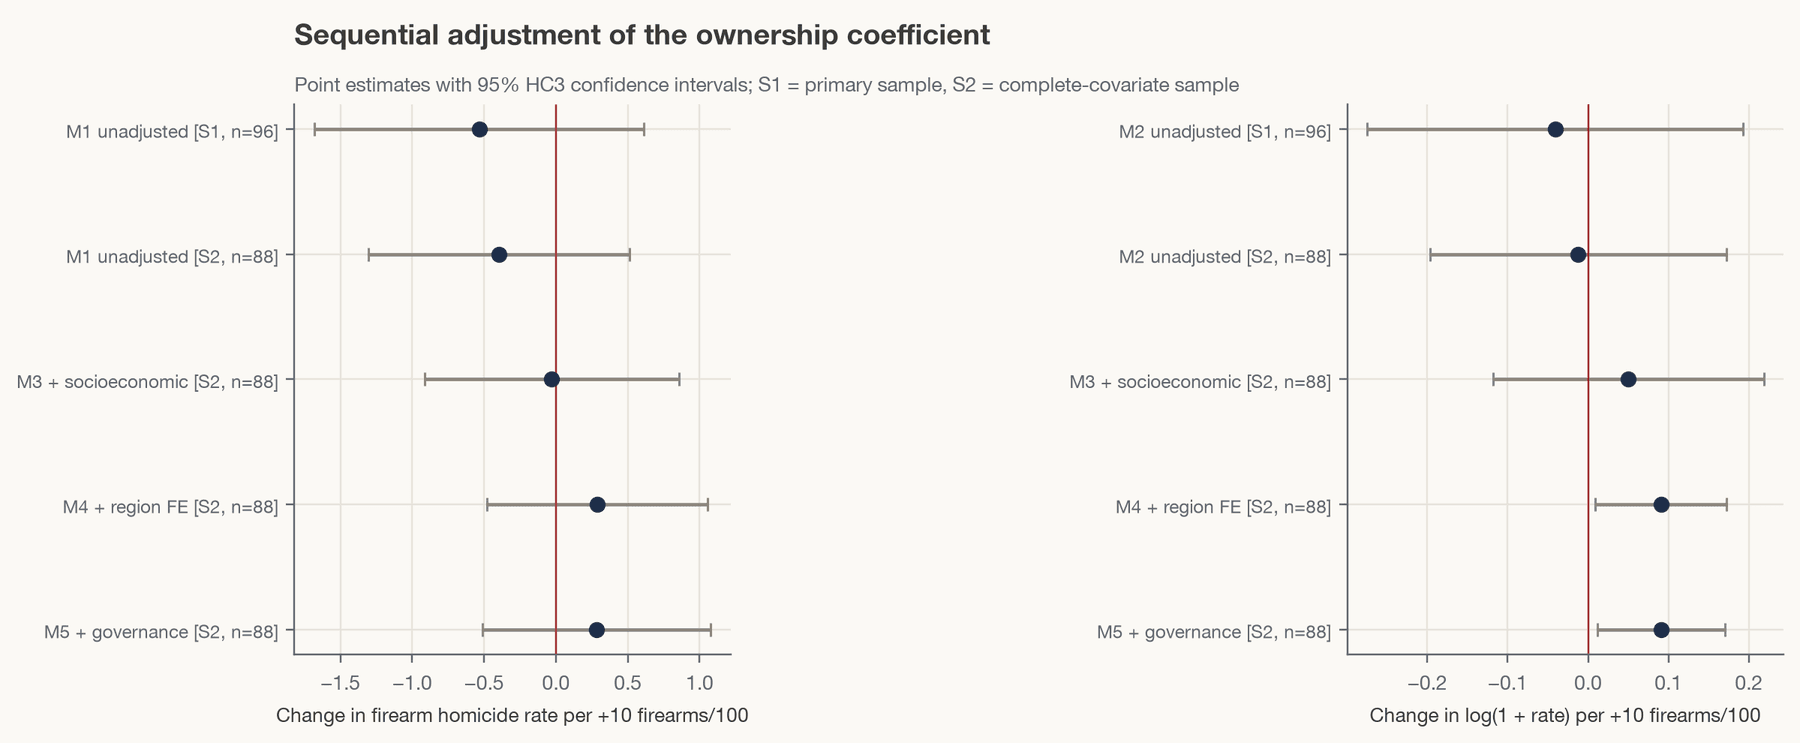
InterpretationThe coefficient turns positive once regional levels are absorbed.
LimitationModel 5 uses 88 countries with complete covariates.
Interactive model · regression Model 5
How much does context matter?
log(1 + rate) · region effects · n = 88 countries
Model-implied firearm homicide rate per 100,000
0.13- 80% residual range
- 0.00 – 1.2
- With +10 firearms / 100
- 0.24
- Region effect
- 0% vs Europe & C. Asia
Urbanisation, unemployment and age structure are held at sample medians. A statistical association between countries, not a causal forecast: compare how much the estimate moves when you change region or governance with how much it moves for +10 firearms.
Regions differ in levels, not detectably in slopes (interaction p = 0.33). About 67% of residual variance in log rates lies between regions. Nonlinear forms add nothing material (spline LR p = 0.12), and the best hinge point is unstable under resampling (3 to 22 firearms per 100).
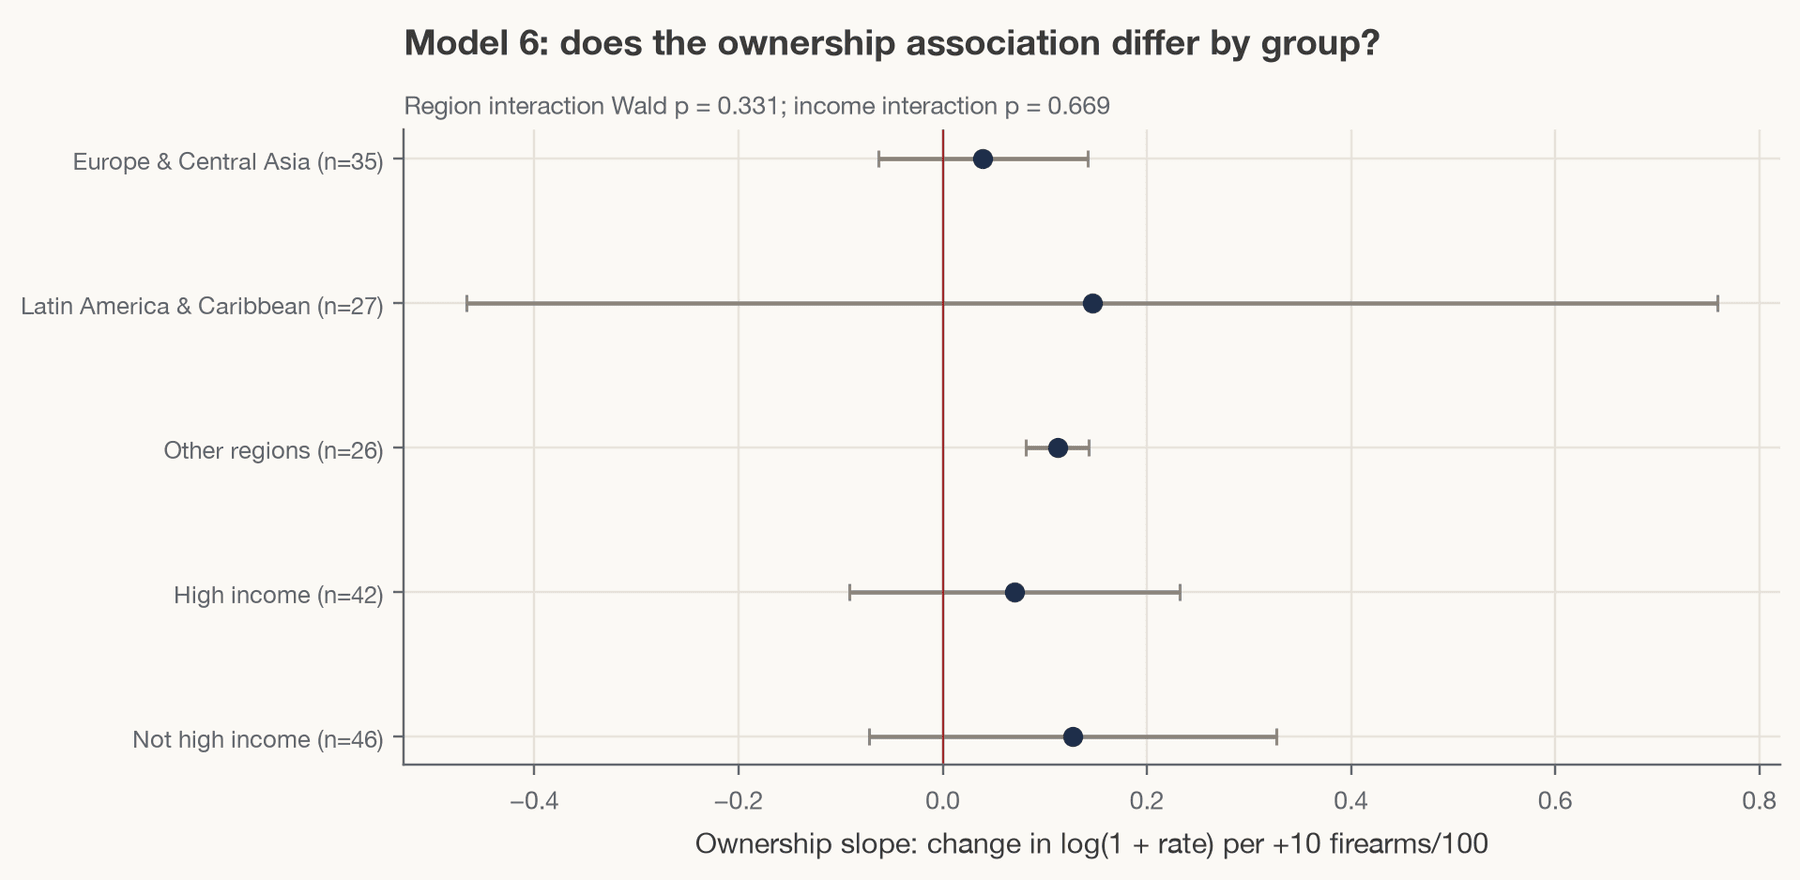
InterpretationSlopes overlap across Europe, Latin America and other regions.
LimitationLow power: groups have 25-35 countries.
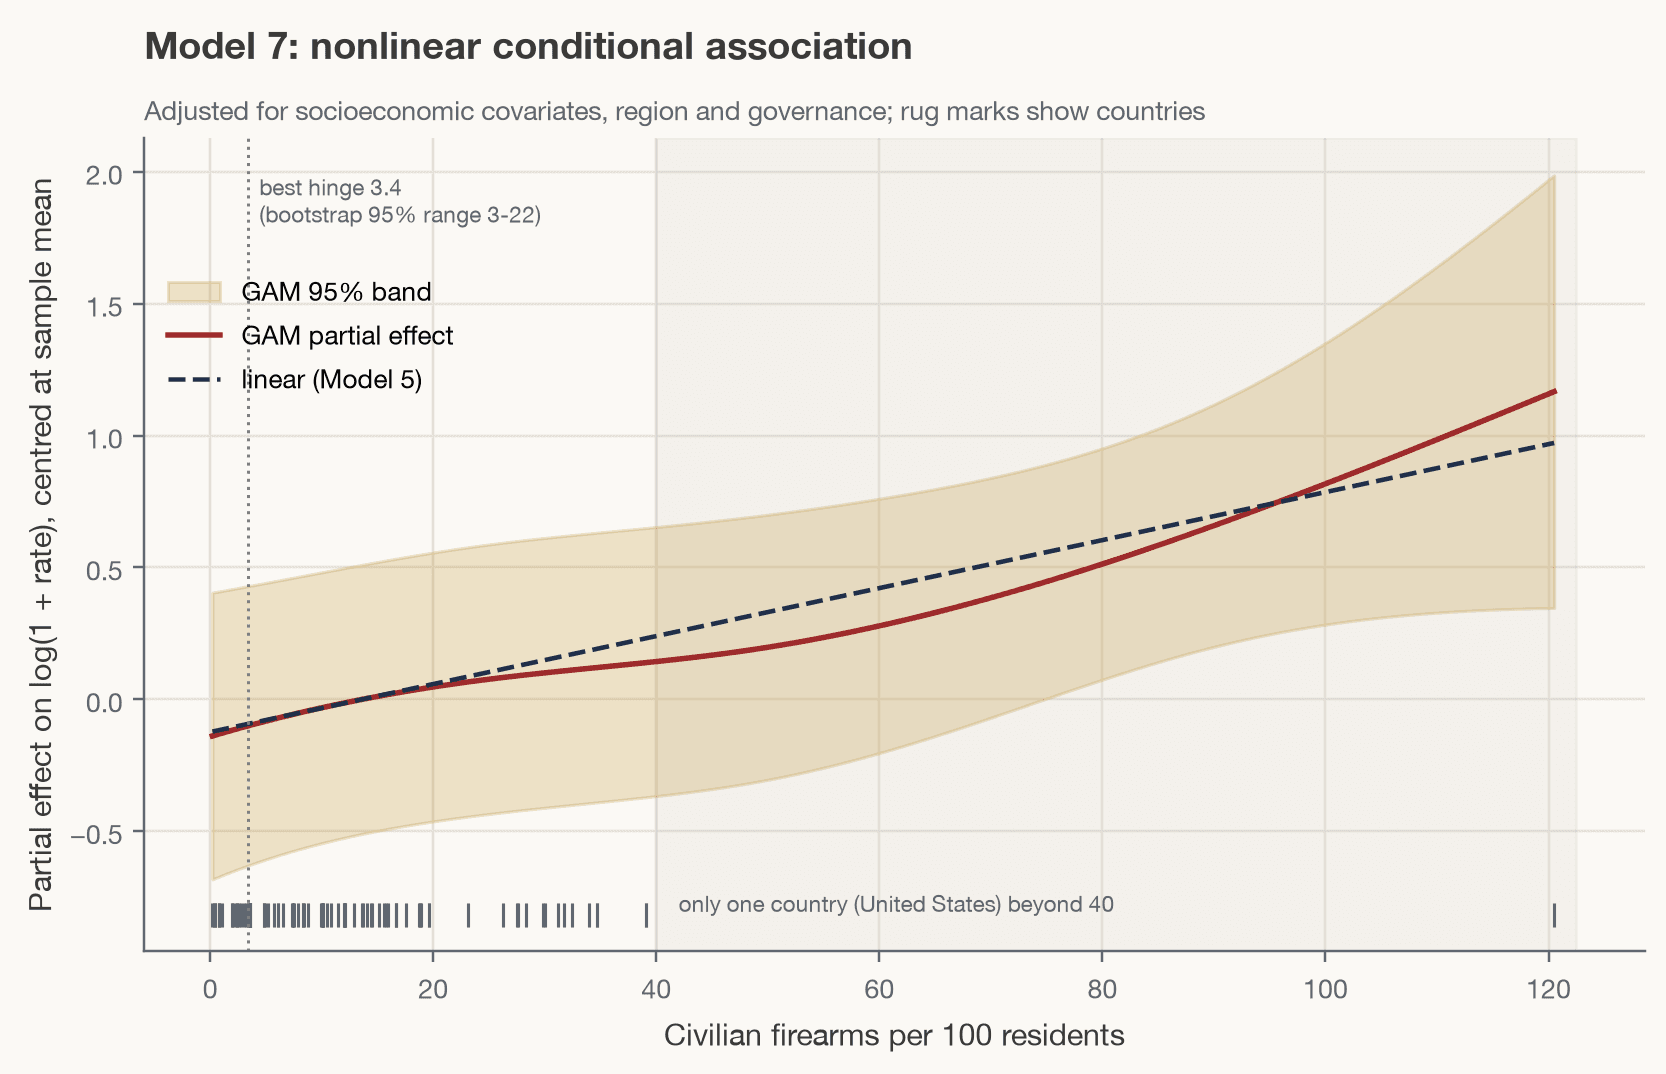
InterpretationA shallow, roughly linear increase; no threshold.
LimitationAbove 40 per 100 the curve rests on the United States alone.
Countries above expectation include El Salvador, Jamaica, Cabo Verde, Honduras; below expectation, Bolivia, Guyana, Suriname, Chile. Only 6 countries fall outside their 95% prediction intervals.
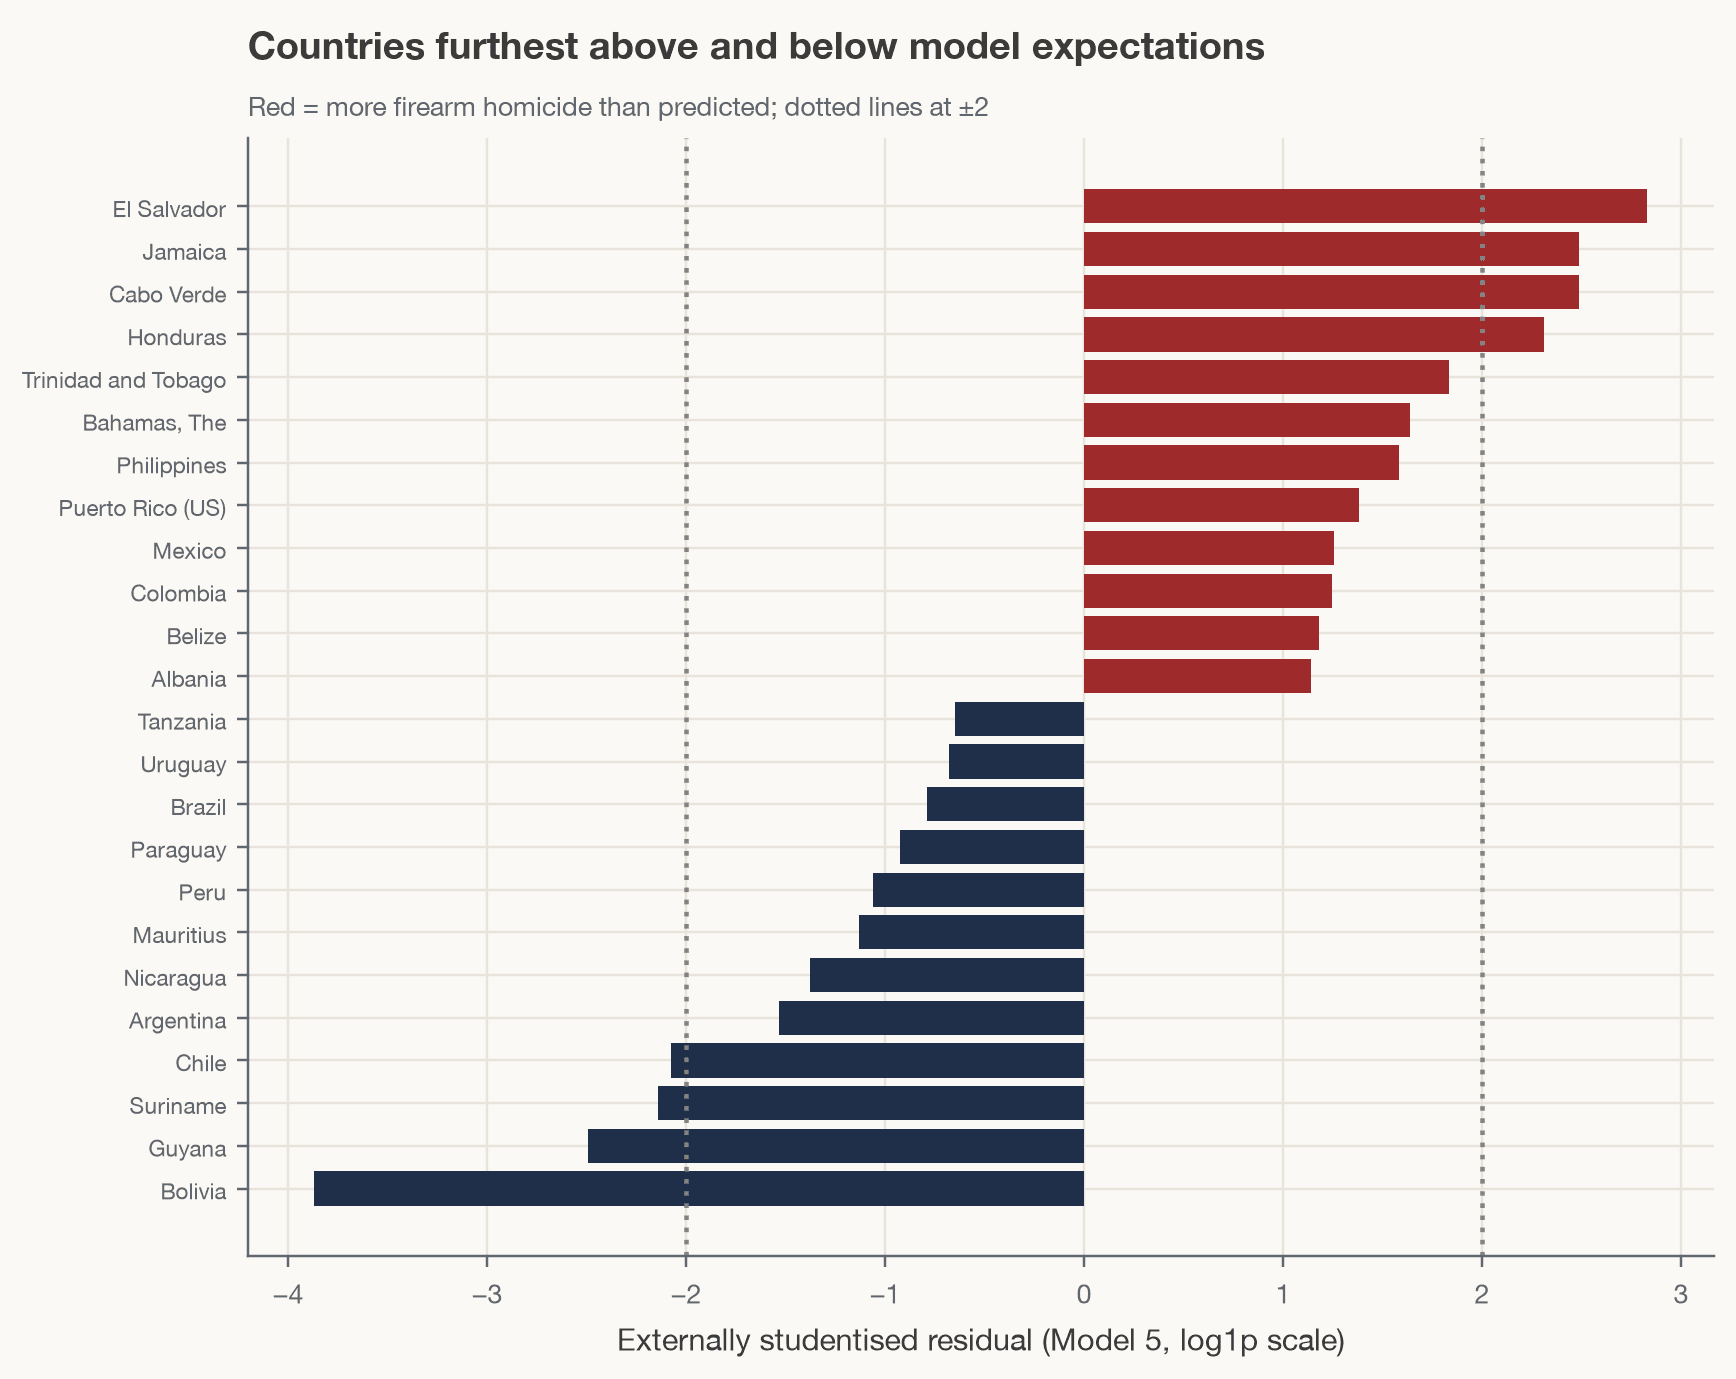
InterpretationCentral America and the Caribbean dominate positive residuals.
LimitationResiduals cannot identify causes; under-recorded mechanisms may explain some negative residuals.
Spatial analysis
Firearm homicide is strongly clustered (Moran's I = 0.85). Region effects absorb most of the clustering in residuals (I falls from 0.79 to 0.26), but what remains is significant (p = 0.001). A spatial lag model leaves the ownership coefficient at 0.089.
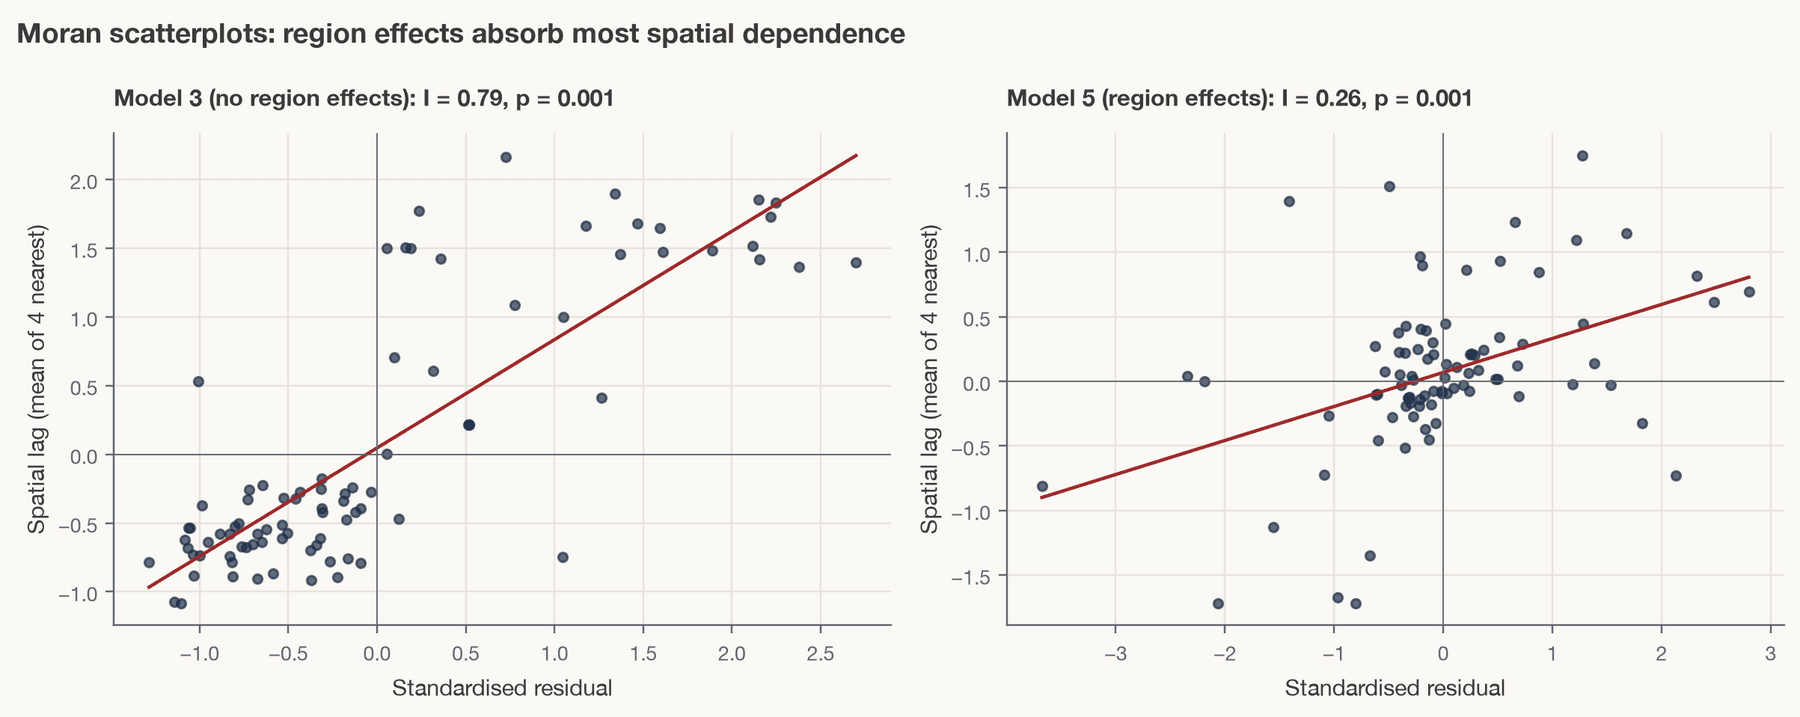
InterpretationRegion effects remove most, not all, spatial dependence.
LimitationClustering is not evidence of spillovers.
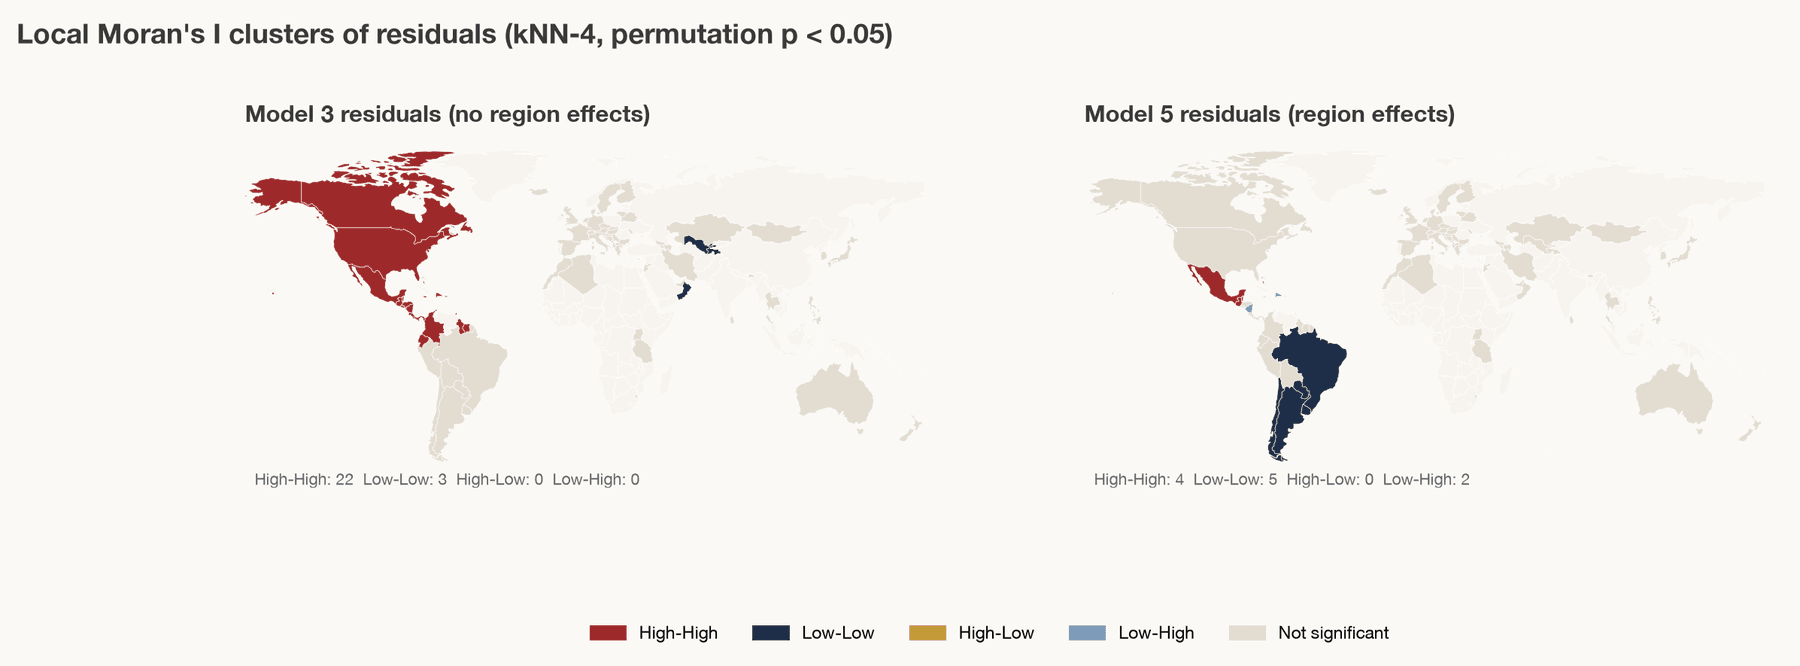
InterpretationA broad Americas high-high cluster shrinks to Mexico and Central America once region is modelled; South America becomes a low-low cluster.
LimitationkNN-4 weights; permutation p < 0.05.
Machine learning
Random forest has the lowest nested cross-validated error (MAE 3.53 per 100,000; log-scale R² 0.55), ahead of linear regression (3.67) and a median baseline (4.42). Fold-to-fold variation is larger than most differences between models.
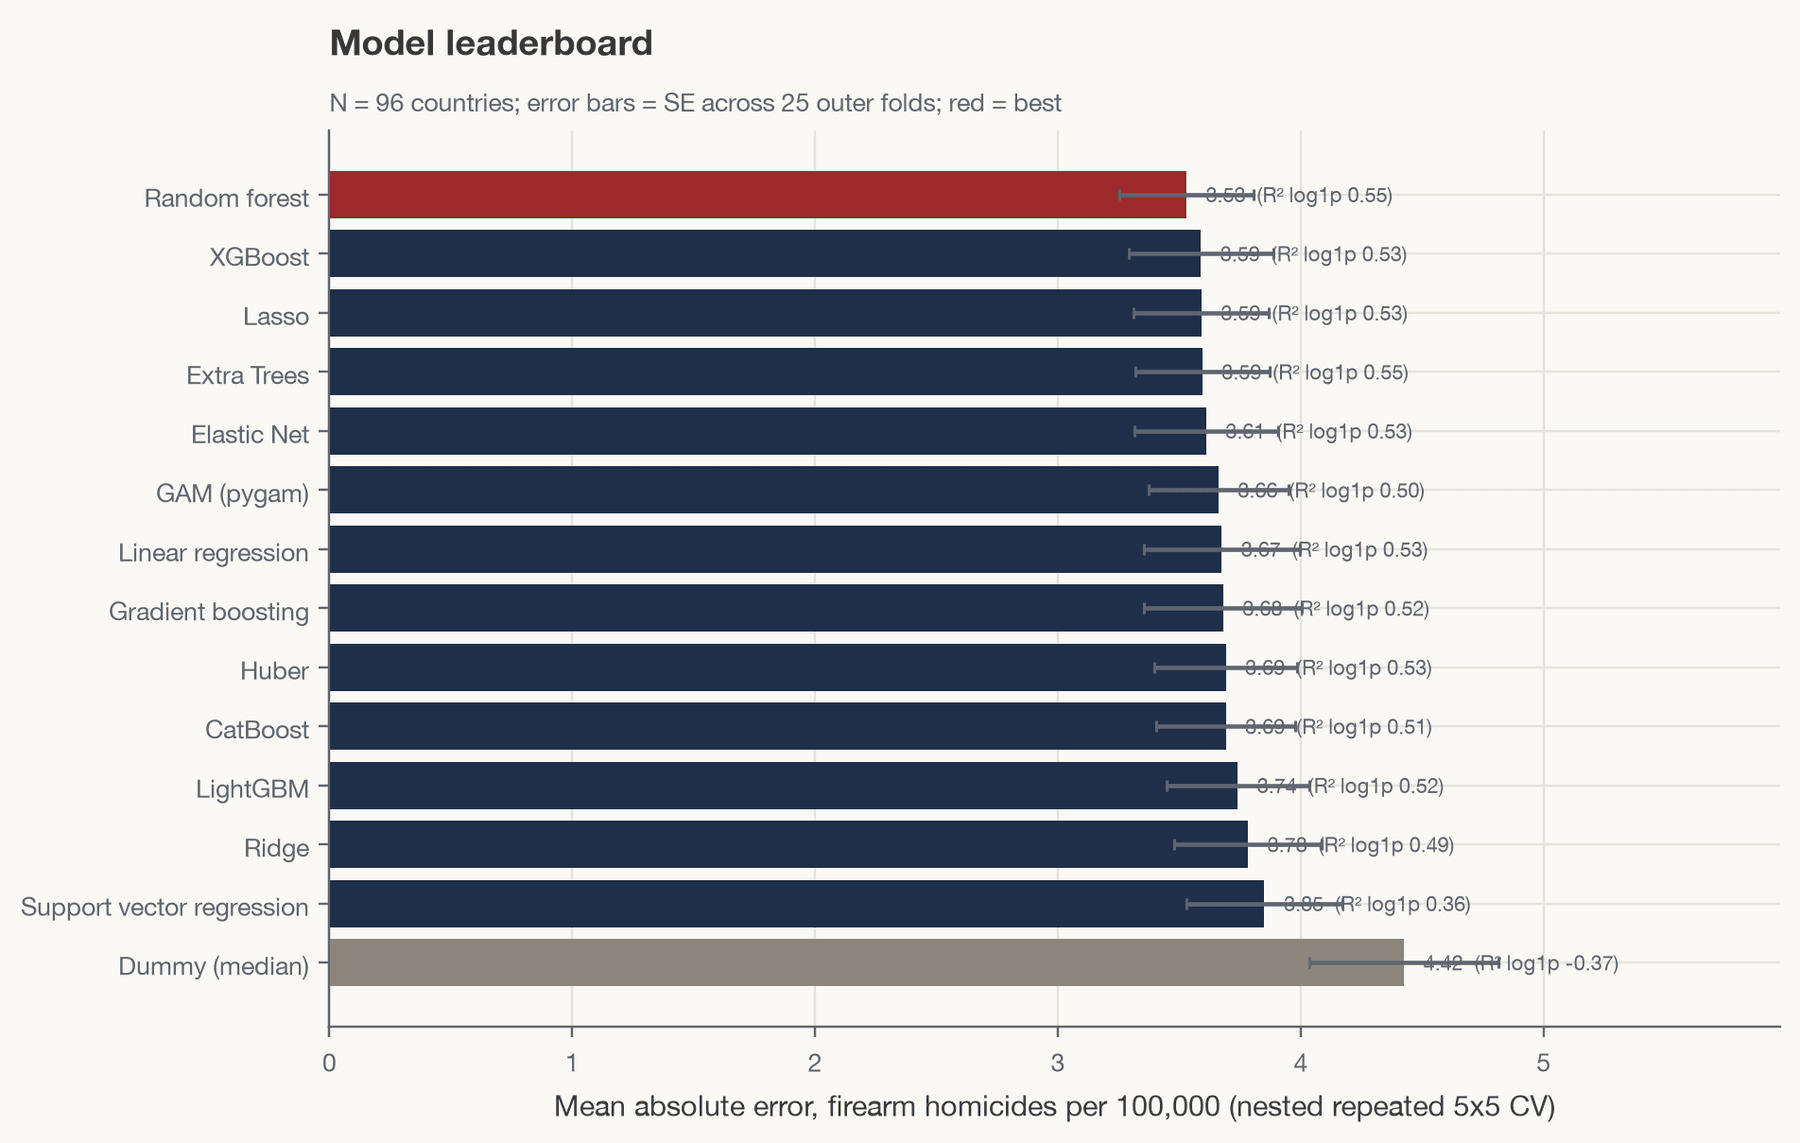
InterpretationFlexible and linear models perform similarly with about 100 countries.
LimitationValidation scores; rate-scale error is dominated by a few very high-rate countries.
Adding firearm prevalence to every other predictor changes random-forest error from 3.49 to 3.47 (-0.5%). Region alone changes it by -12.6%.
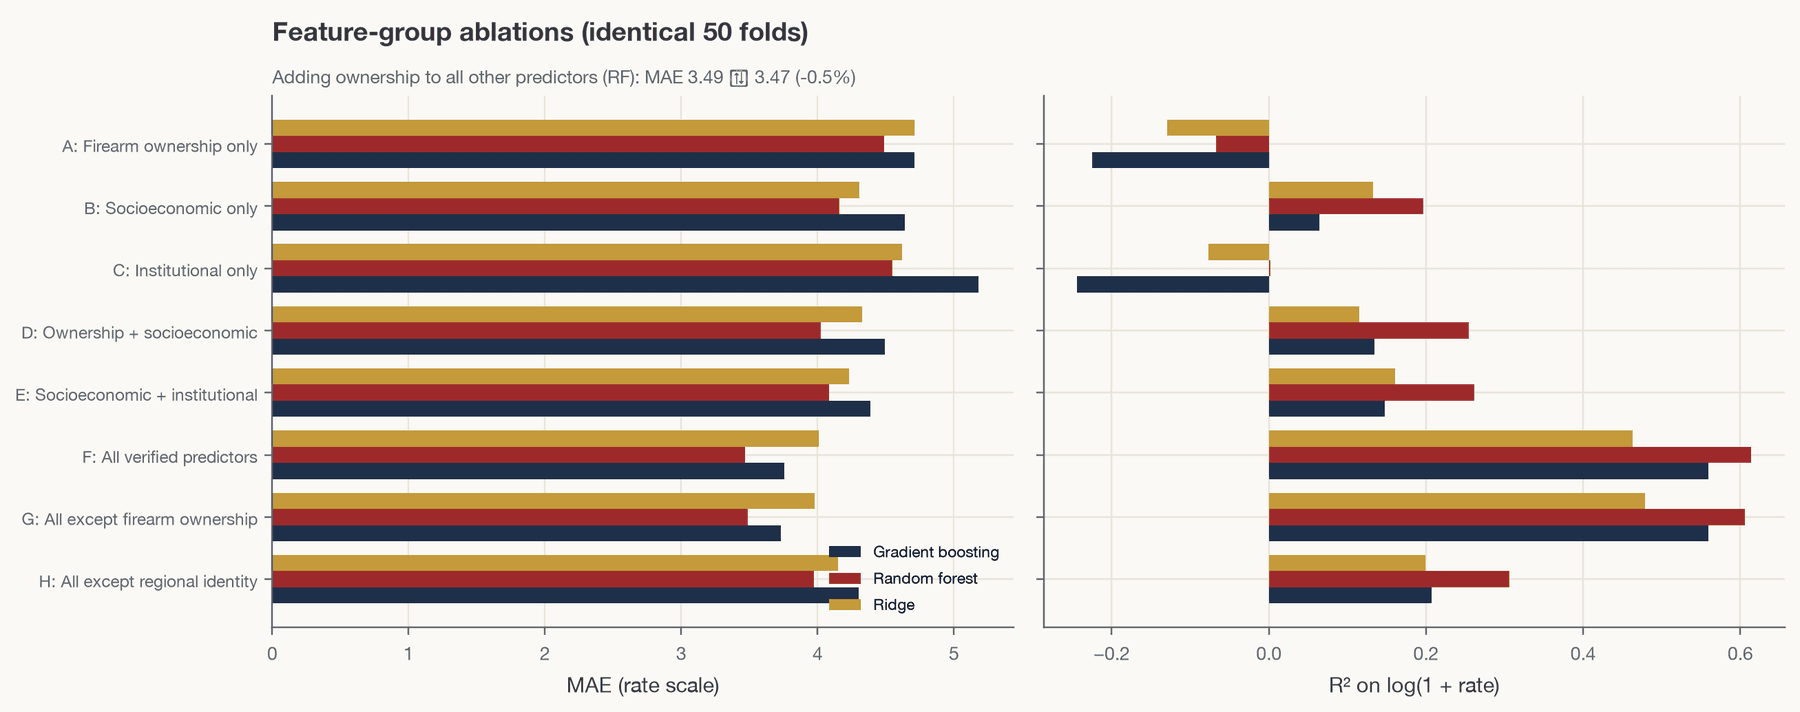
InterpretationFirearm prevalence alone predicts like a constant; region and governance carry the signal.
LimitationSmall incremental predictive value is not evidence of no causal effect.
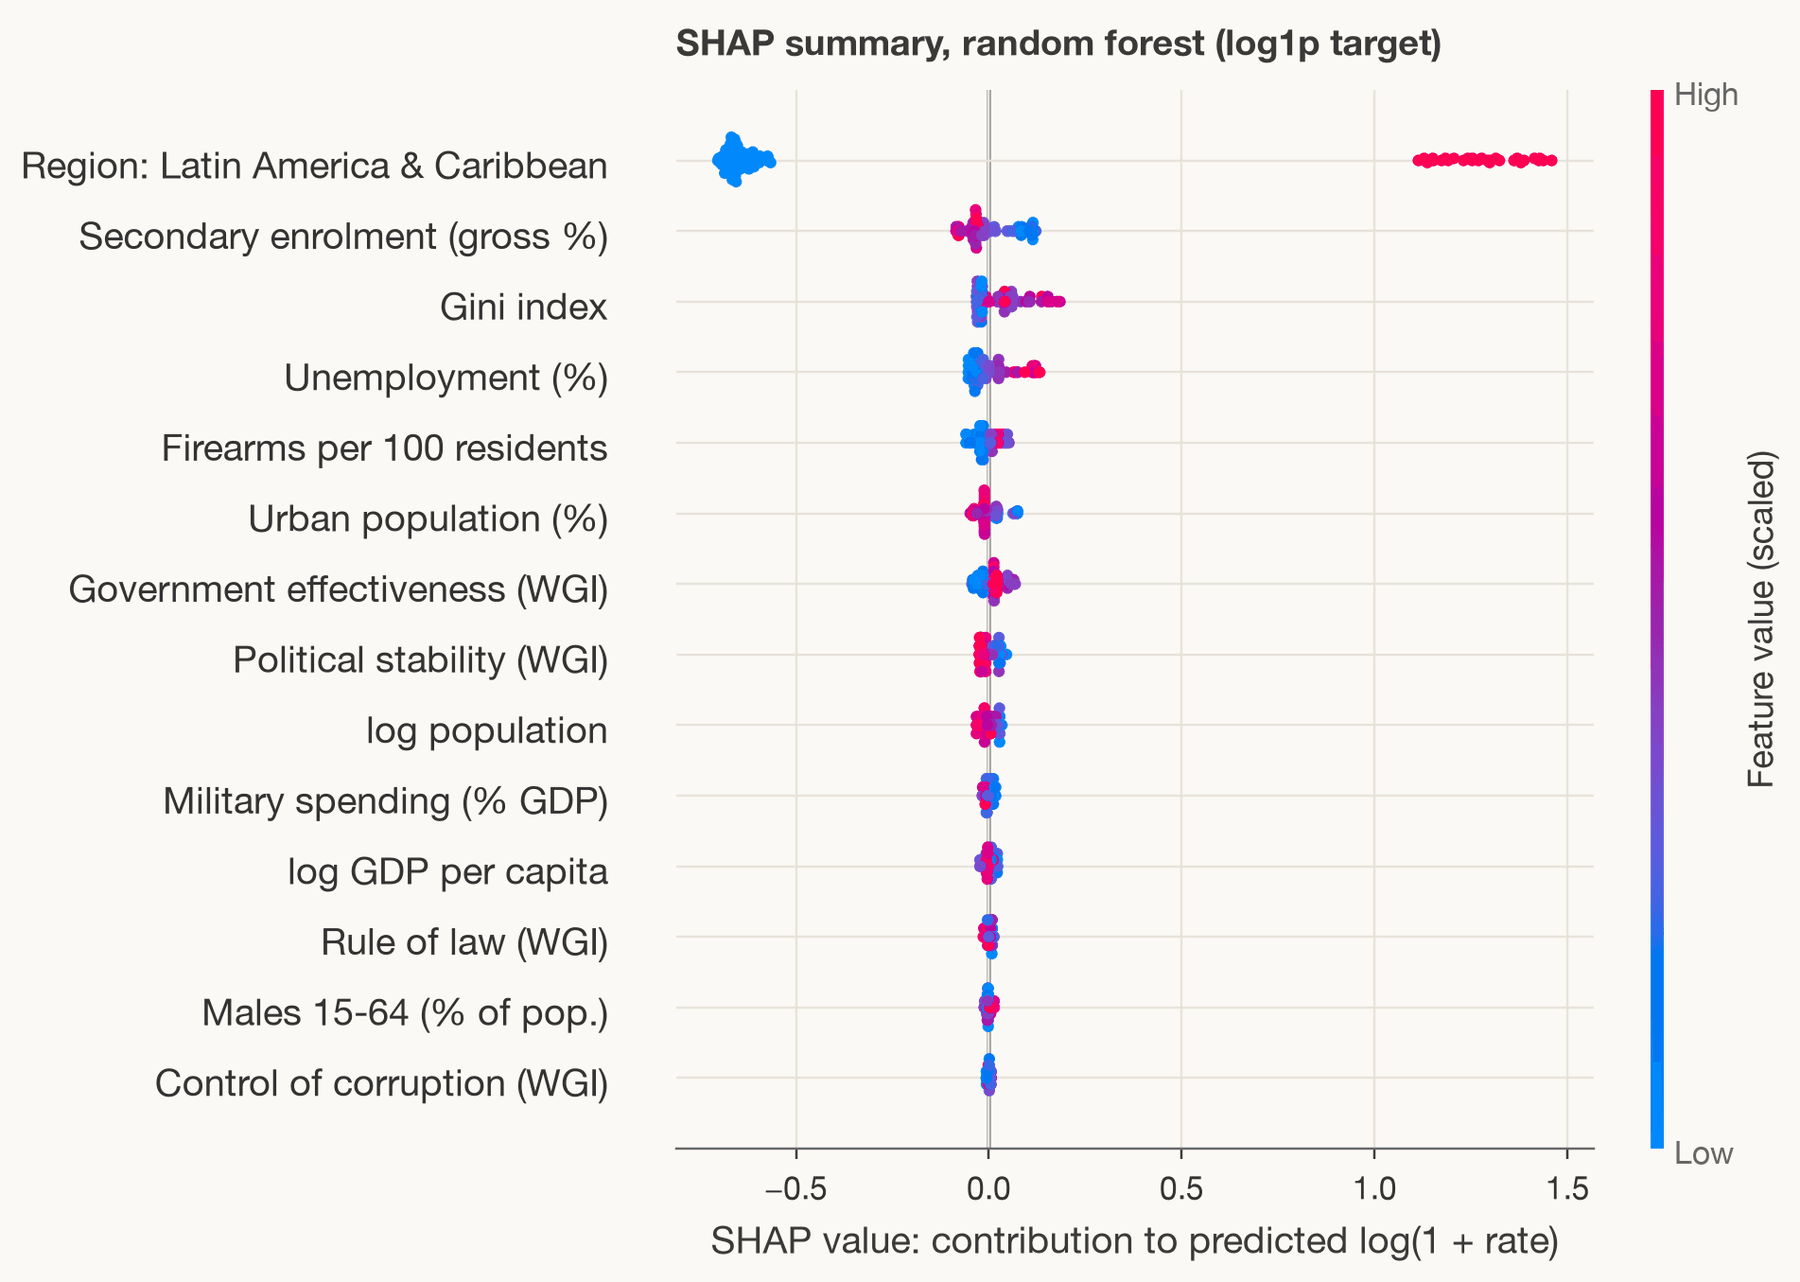
InterpretationFirearm prevalence carries 2% of attribution; region 75% and governance 4%.
LimitationModel attributions, not causal effects; correlated predictors share credit.
Robustness
The adjusted coefficient was re-estimated under 34 specifications. It is positive in 97% and has a confidence interval above zero in 62%. It survives outcome transformations, influence and conflict exclusions, robust estimators and alternative windows, but not removal of the United States (p = 0.168), population weighting, multiple imputation or continental region controls.
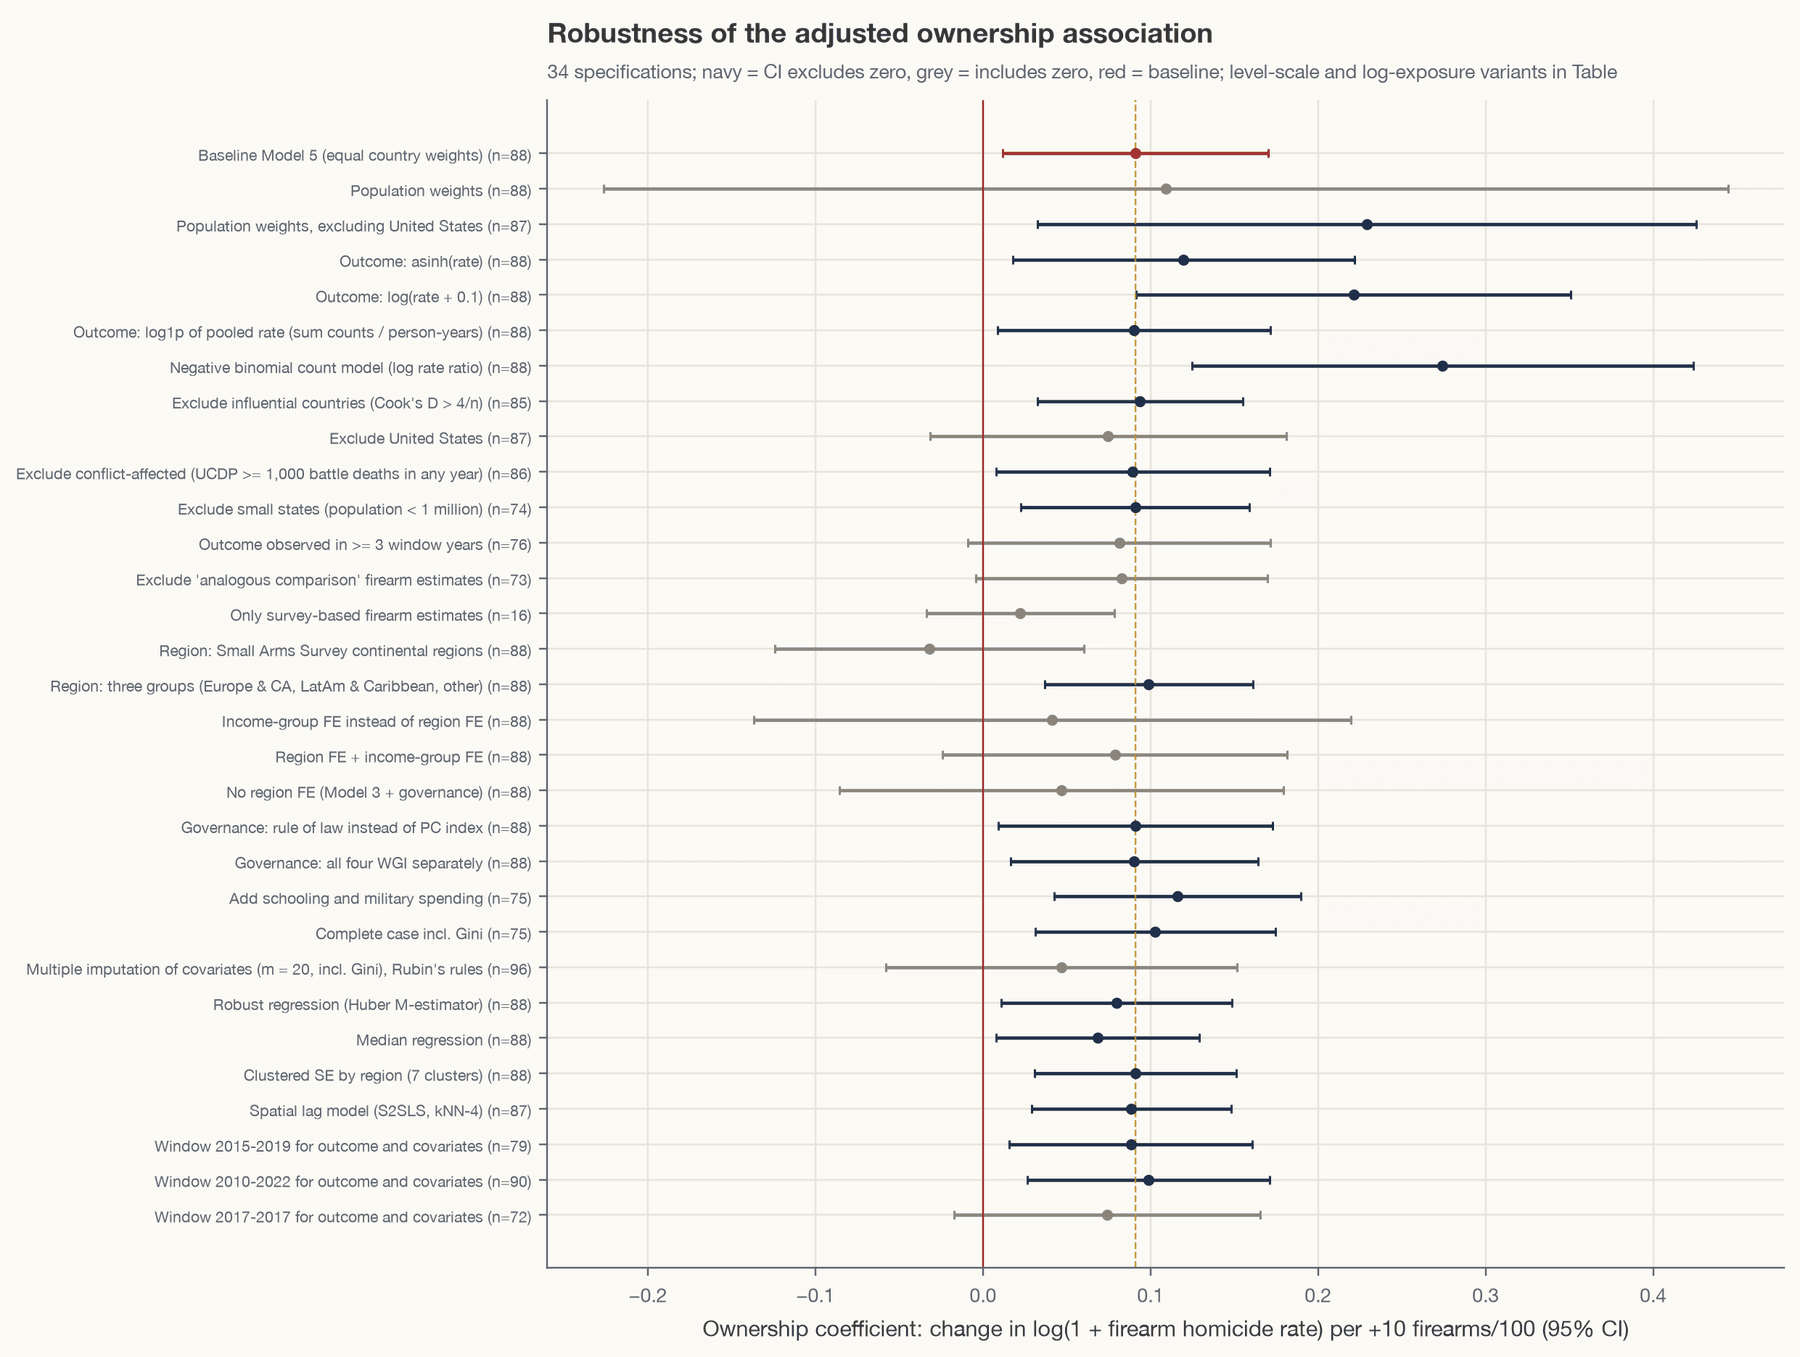
InterpretationNever significantly negative; often not significantly positive.
LimitationSpecifications are not independent tests.
Limitations
Conclusion
Cross-national differences in firearm homicide are explained far more by where a country is and how it is governed than by how many civilian firearms it holds. A modest positive conditional association with firearm prevalence (about 10% per 10 firearms per 100 on the log scale) is visible in several specifications but is fragile, adds little predictive information, and is not a causal estimate.
References
- [1]
Karp, A. (2018). Estimating global civilian-held firearms numbers. Small Arms Survey Briefing Paper. Source
- [2]
UNODC (2023). Global study on homicide 2023. United Nations Office on Drugs and Crime. Source
- [3]
Hemenway, D., & Miller, M. (2000). Firearm availability and homicide rates across 26 high-income countries. Journal of Trauma, 49(6), 985-988. Source
- [4]
Kleck, G. (2015). The impact of gun ownership rates on crime rates: A methodological review of the evidence. Journal of Criminal Justice, 43(1), 40-48. Source
- [5]
Fajnzylber, P., Lederman, D., & Loayza, N. (2002). Inequality and violent crime. Journal of Law and Economics, 45(1), 1-39. Source
- [6]
Kaufmann, D., Kraay, A., & Mastruzzi, M. (2011). The Worldwide Governance Indicators: Methodology and analytical issues. Hague Journal on the Rule of Law, 3(2), 220-246. Source
- [7]
Anselin, L. (1995). Local indicators of spatial association - LISA. Geographical Analysis, 27(2), 93-115. Source
- [8]
Robinson, W. S. (1950). Ecological correlations and the behavior of individuals. American Sociological Review, 15(3), 351-357. Source
Complete paper
The complete 52-page paper contains the full methods, 13 tables, 52 figures, references, appendices and reproducibility notes. Its author line and PDF metadata identify Akshay Byagathvalli.