Akshay Byagathvalli analyzes a 1,548-row synthetic panel covering 24 critical minerals, 35 producer countries, and 2015-2026. The study combines concentration measurement, producer networks, fixed-effects inference, vulnerability indexing, supply-shock simulation, temporal machine learning, explainability, and weight sensitivity to identify structural chokepoints without presenting simulated values as official production statistics.
Panel
1,548 rows24 minerals · 35 countriesSystemic node
ChinaLeading producer for 15 mineralsMedian shock loss
31.2%50% dominant-producer disruptionGallium CVaR95
61.6%Medium structural-stress regimeHow has geographic concentration evolved from 2015-2026, and to what extent can concentration, volatility, growth, diversification, reserves, and producer-network structure explain and predict structural exposure to supply disruptions?
The paper measures vulnerability inside the supplied data and declared stress scenarios. It does not estimate real geopolitical-event probabilities.
Dataset
Dataset summary
Critical Minerals and Rare Earths, 2015-2026
- Observations
- 1,548 country-mineral-year rows
- Features
- 24 minerals · 35 countries
- Target
- Next-year simulated structural SupplyCVaR95
- Source
- Supplied Kaggle synthetic panel
The source dictionary labels mine production, reserves, prices, and major risk fields as simulated. The project therefore treats the dataset as a reproducible structural laboratory rather than an audited description of world production. Supplied production shares failed adding-up checks in 268 of 288 mineral-years, so the pipeline recomputed shares and downstream concentration measures from tonnage.
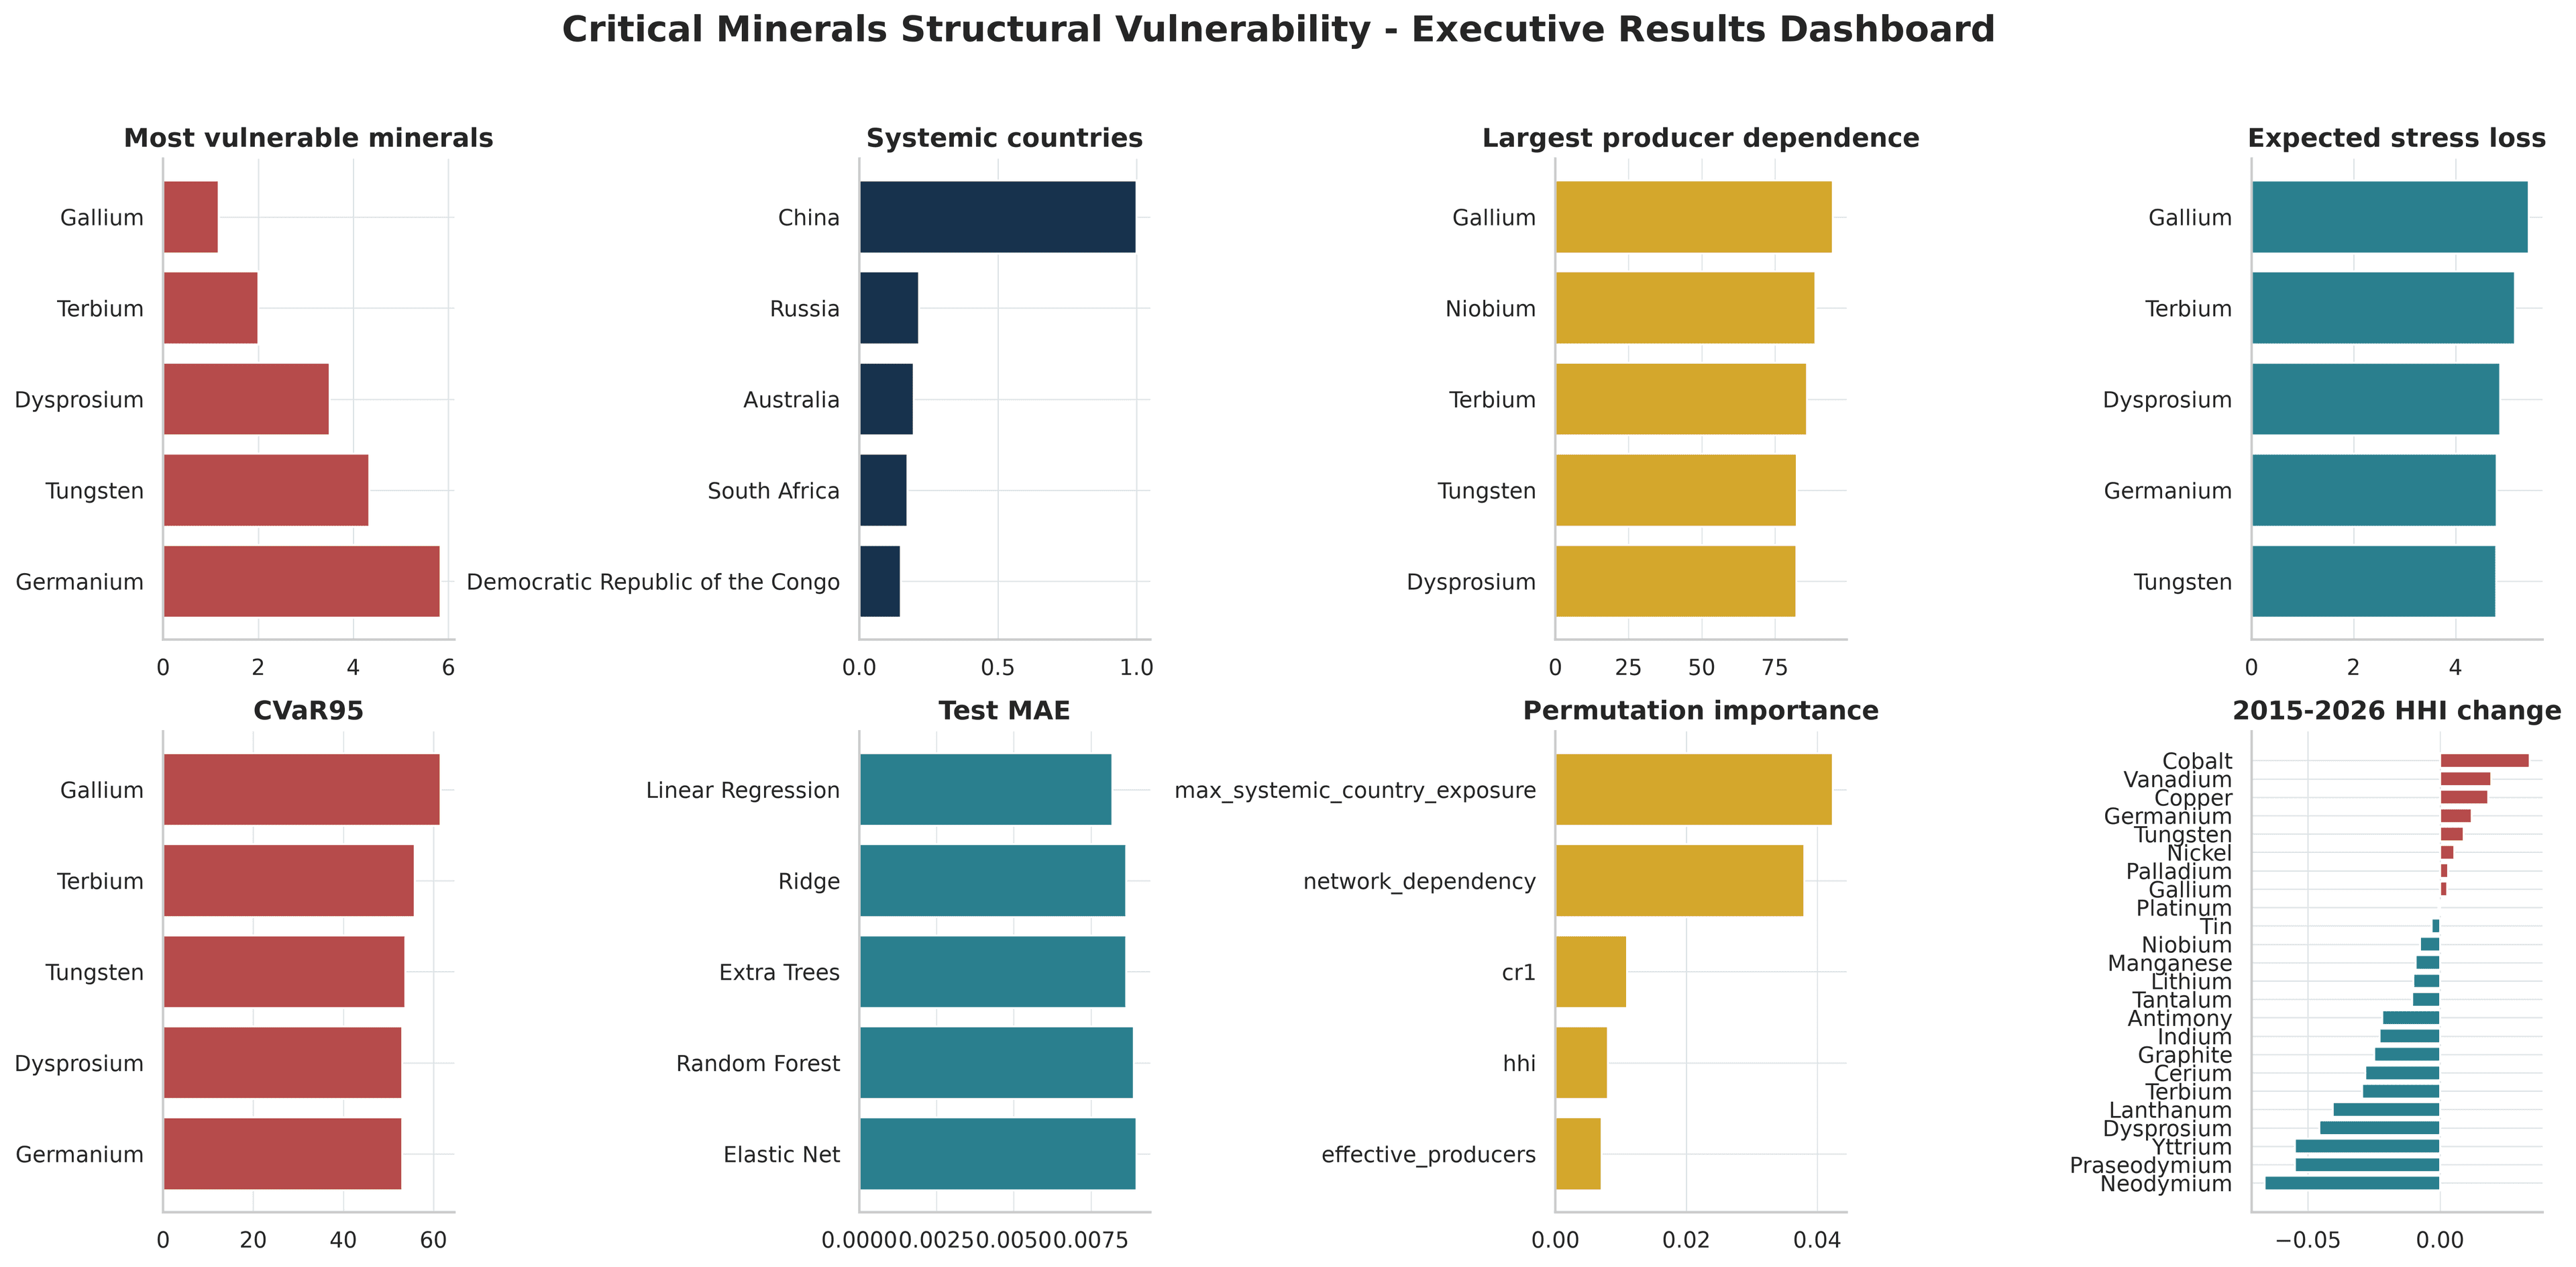
InterpretationThe dashboard links concentration, network structure, simulated tail loss, and consensus rankings in one view.
LimitationEvery numeric result characterizes the supplied synthetic panel and declared scenarios.
Methodology
Audit and recompute
Measure structure
Map chokepoints
Stress and validate
Concentration
Mean HHI fell by 0.014 from 2015 to 2026: 16 minerals diversified and eight concentrated. The paired t-test produced p = 0.017, but the average hides persistent extremes. Gallium's 2026 HHI was 0.900, equivalent to only 1.111 effective producers.
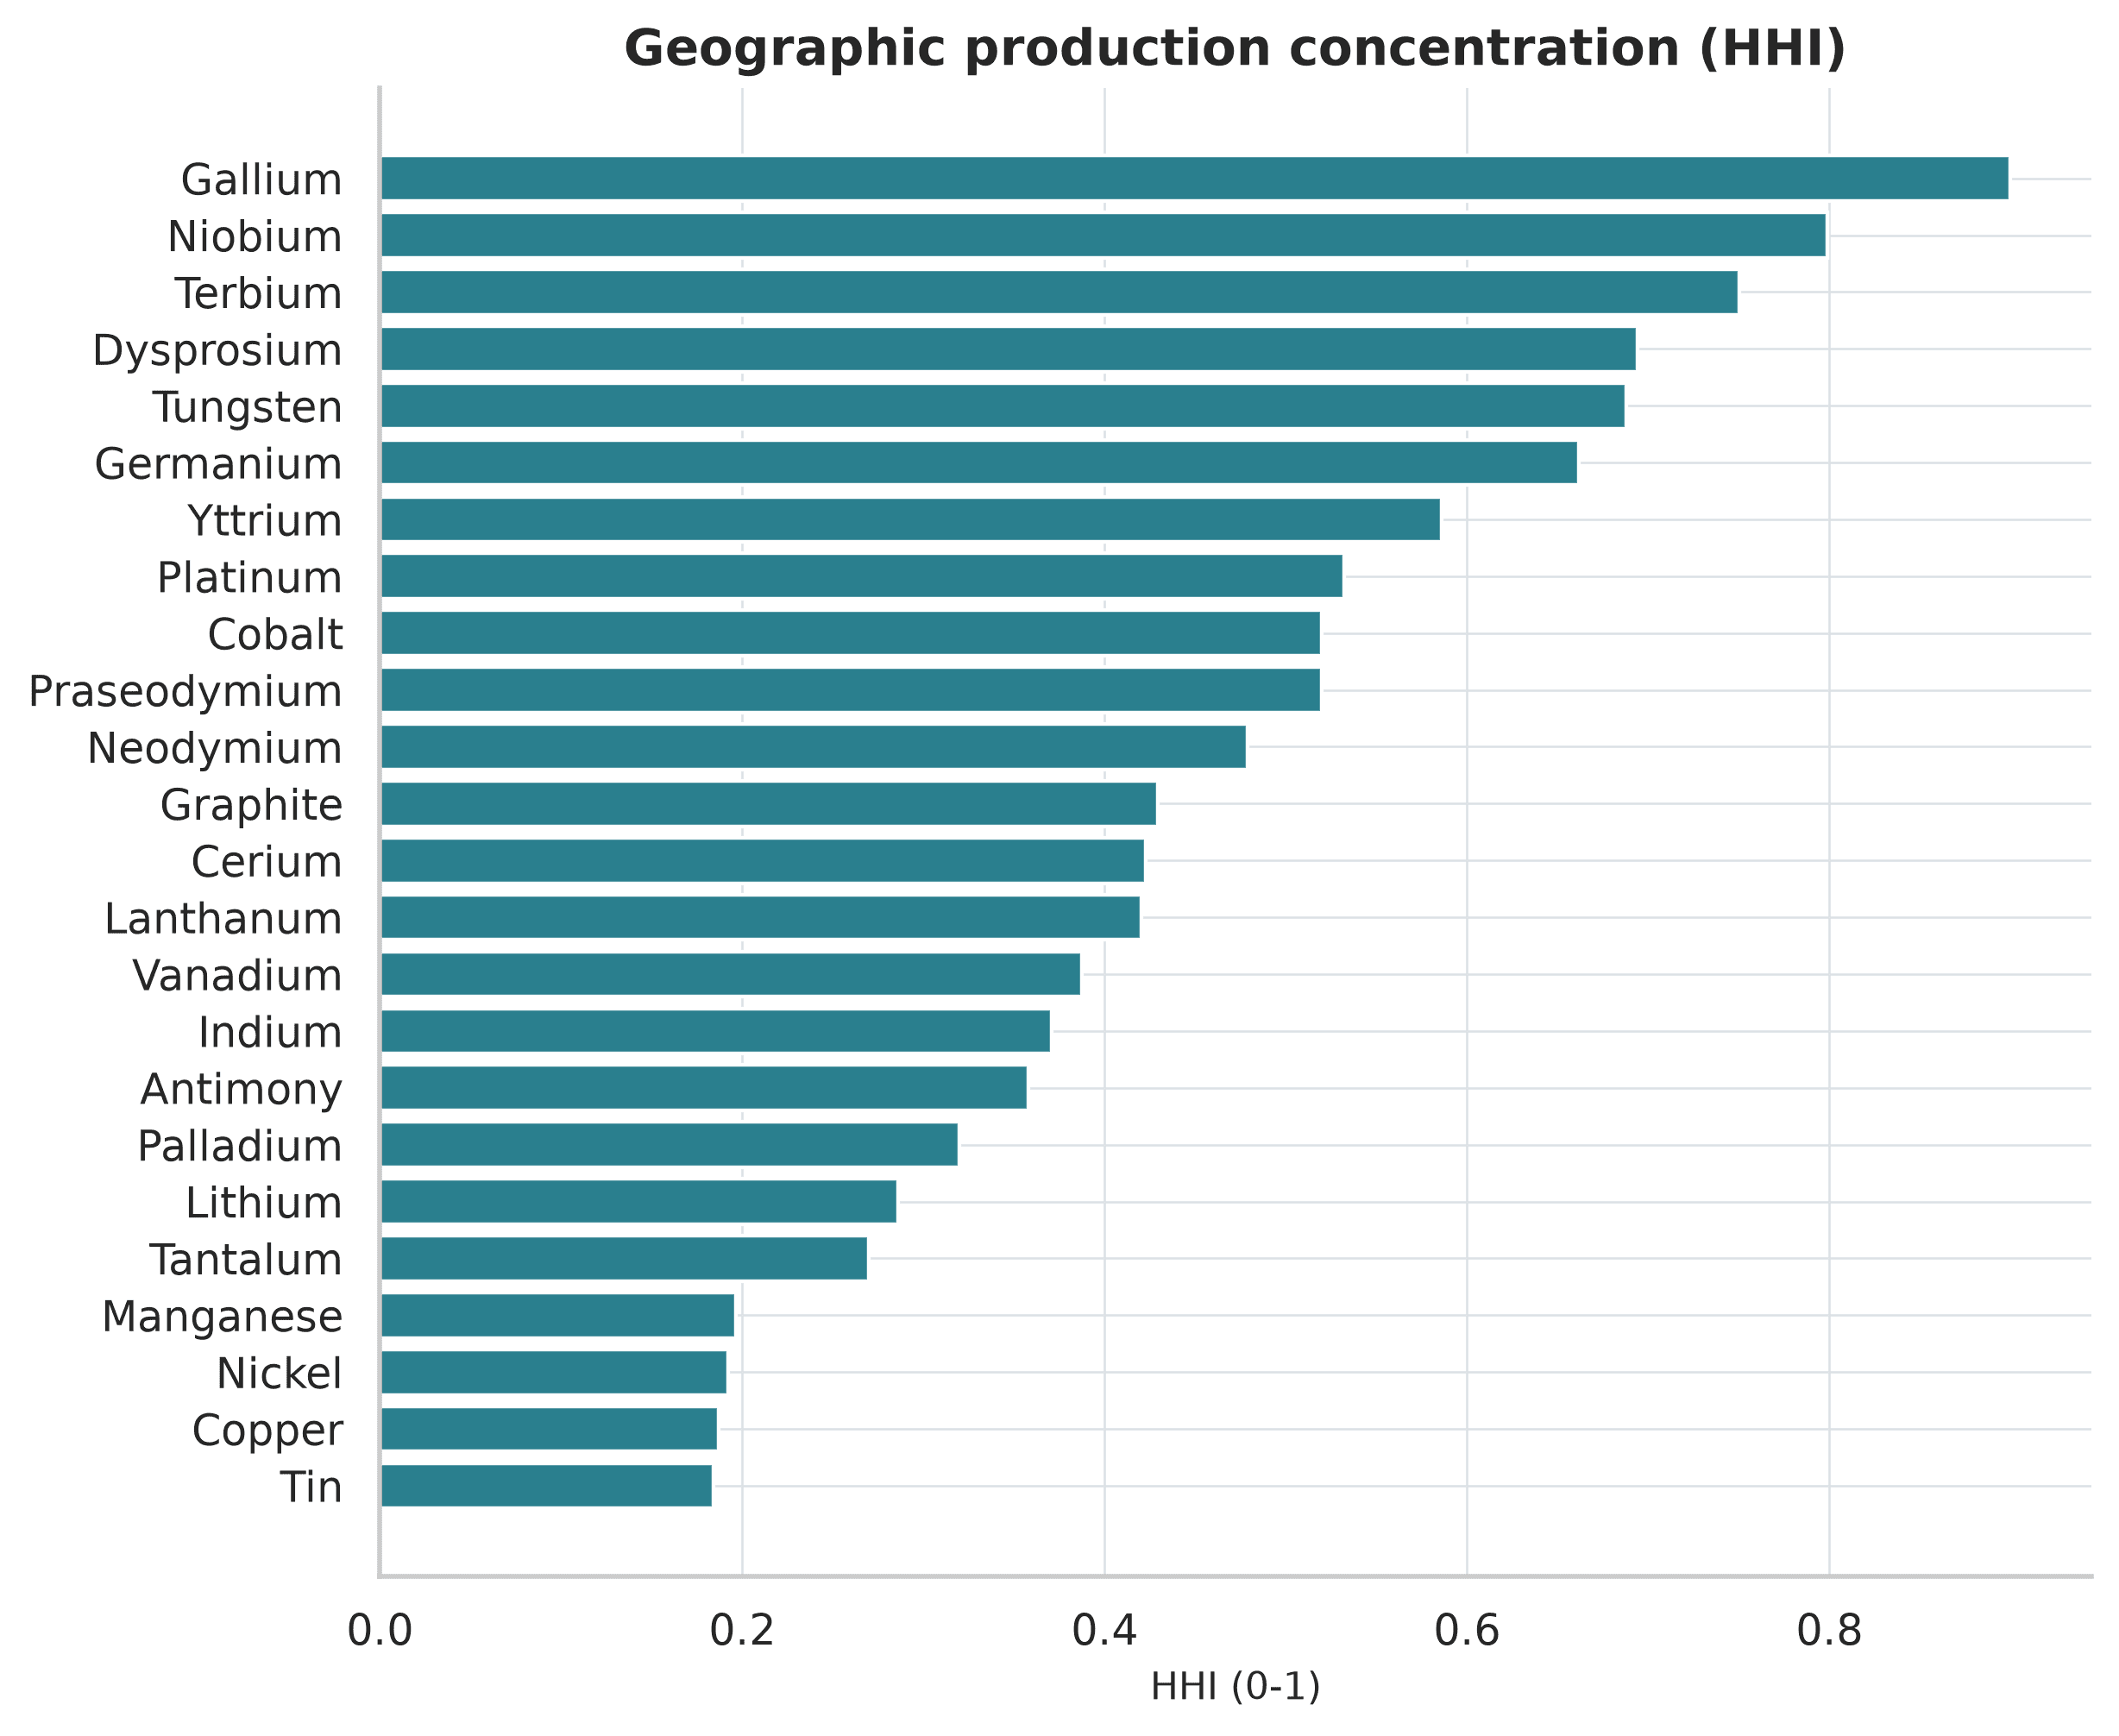
InterpretationGallium, Niobium, Terbium, Dysprosium, and Tungsten occupy the concentrated end of the latest-year distribution.
LimitationHHI describes the supplied production-share structure; it does not measure substitution, inventories, recycling, or refining capacity.
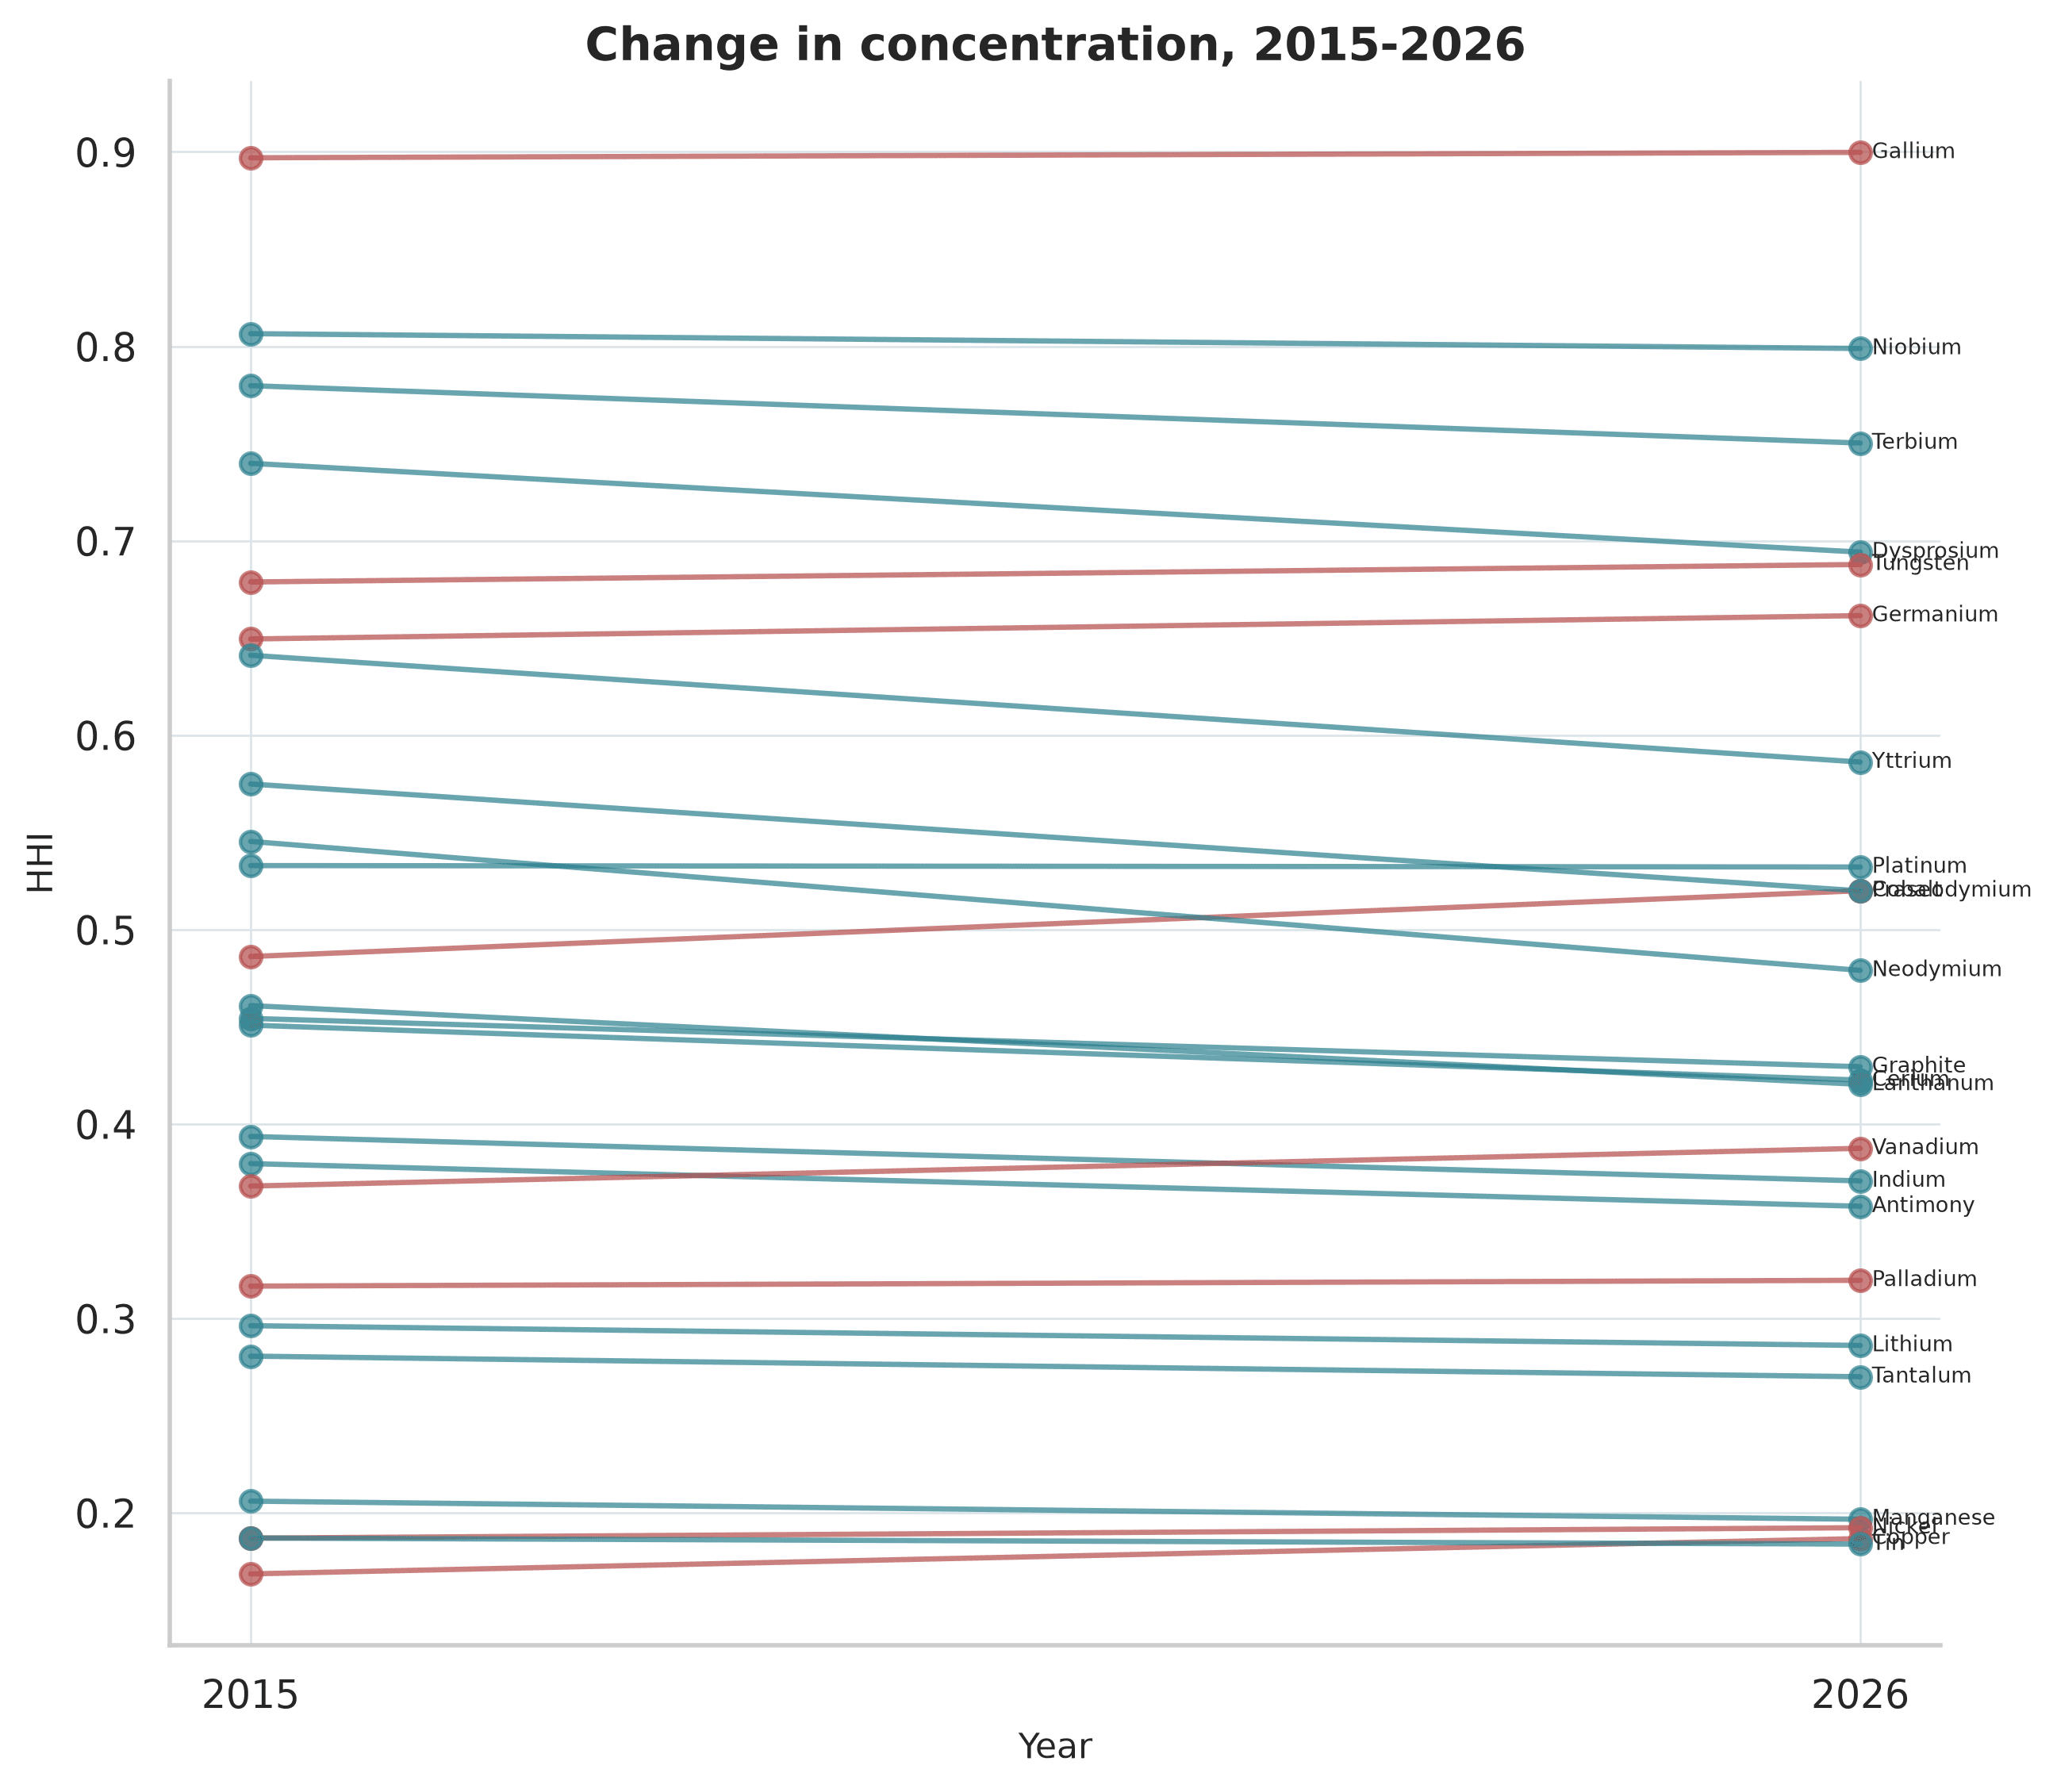
InterpretationMost minerals diversified modestly, although several remained highly concentrated at the end of the period.
LimitationA favorable direction of change does not imply a low endpoint risk.
Network analysis
China was the dominant systemic country by a wide margin: it led 15 of 24 minerals, had normalized systemic score 1.000, and produced a mean cross-mineral loss of 44.4% when removed, compared with 2.8% for a random-country removal.
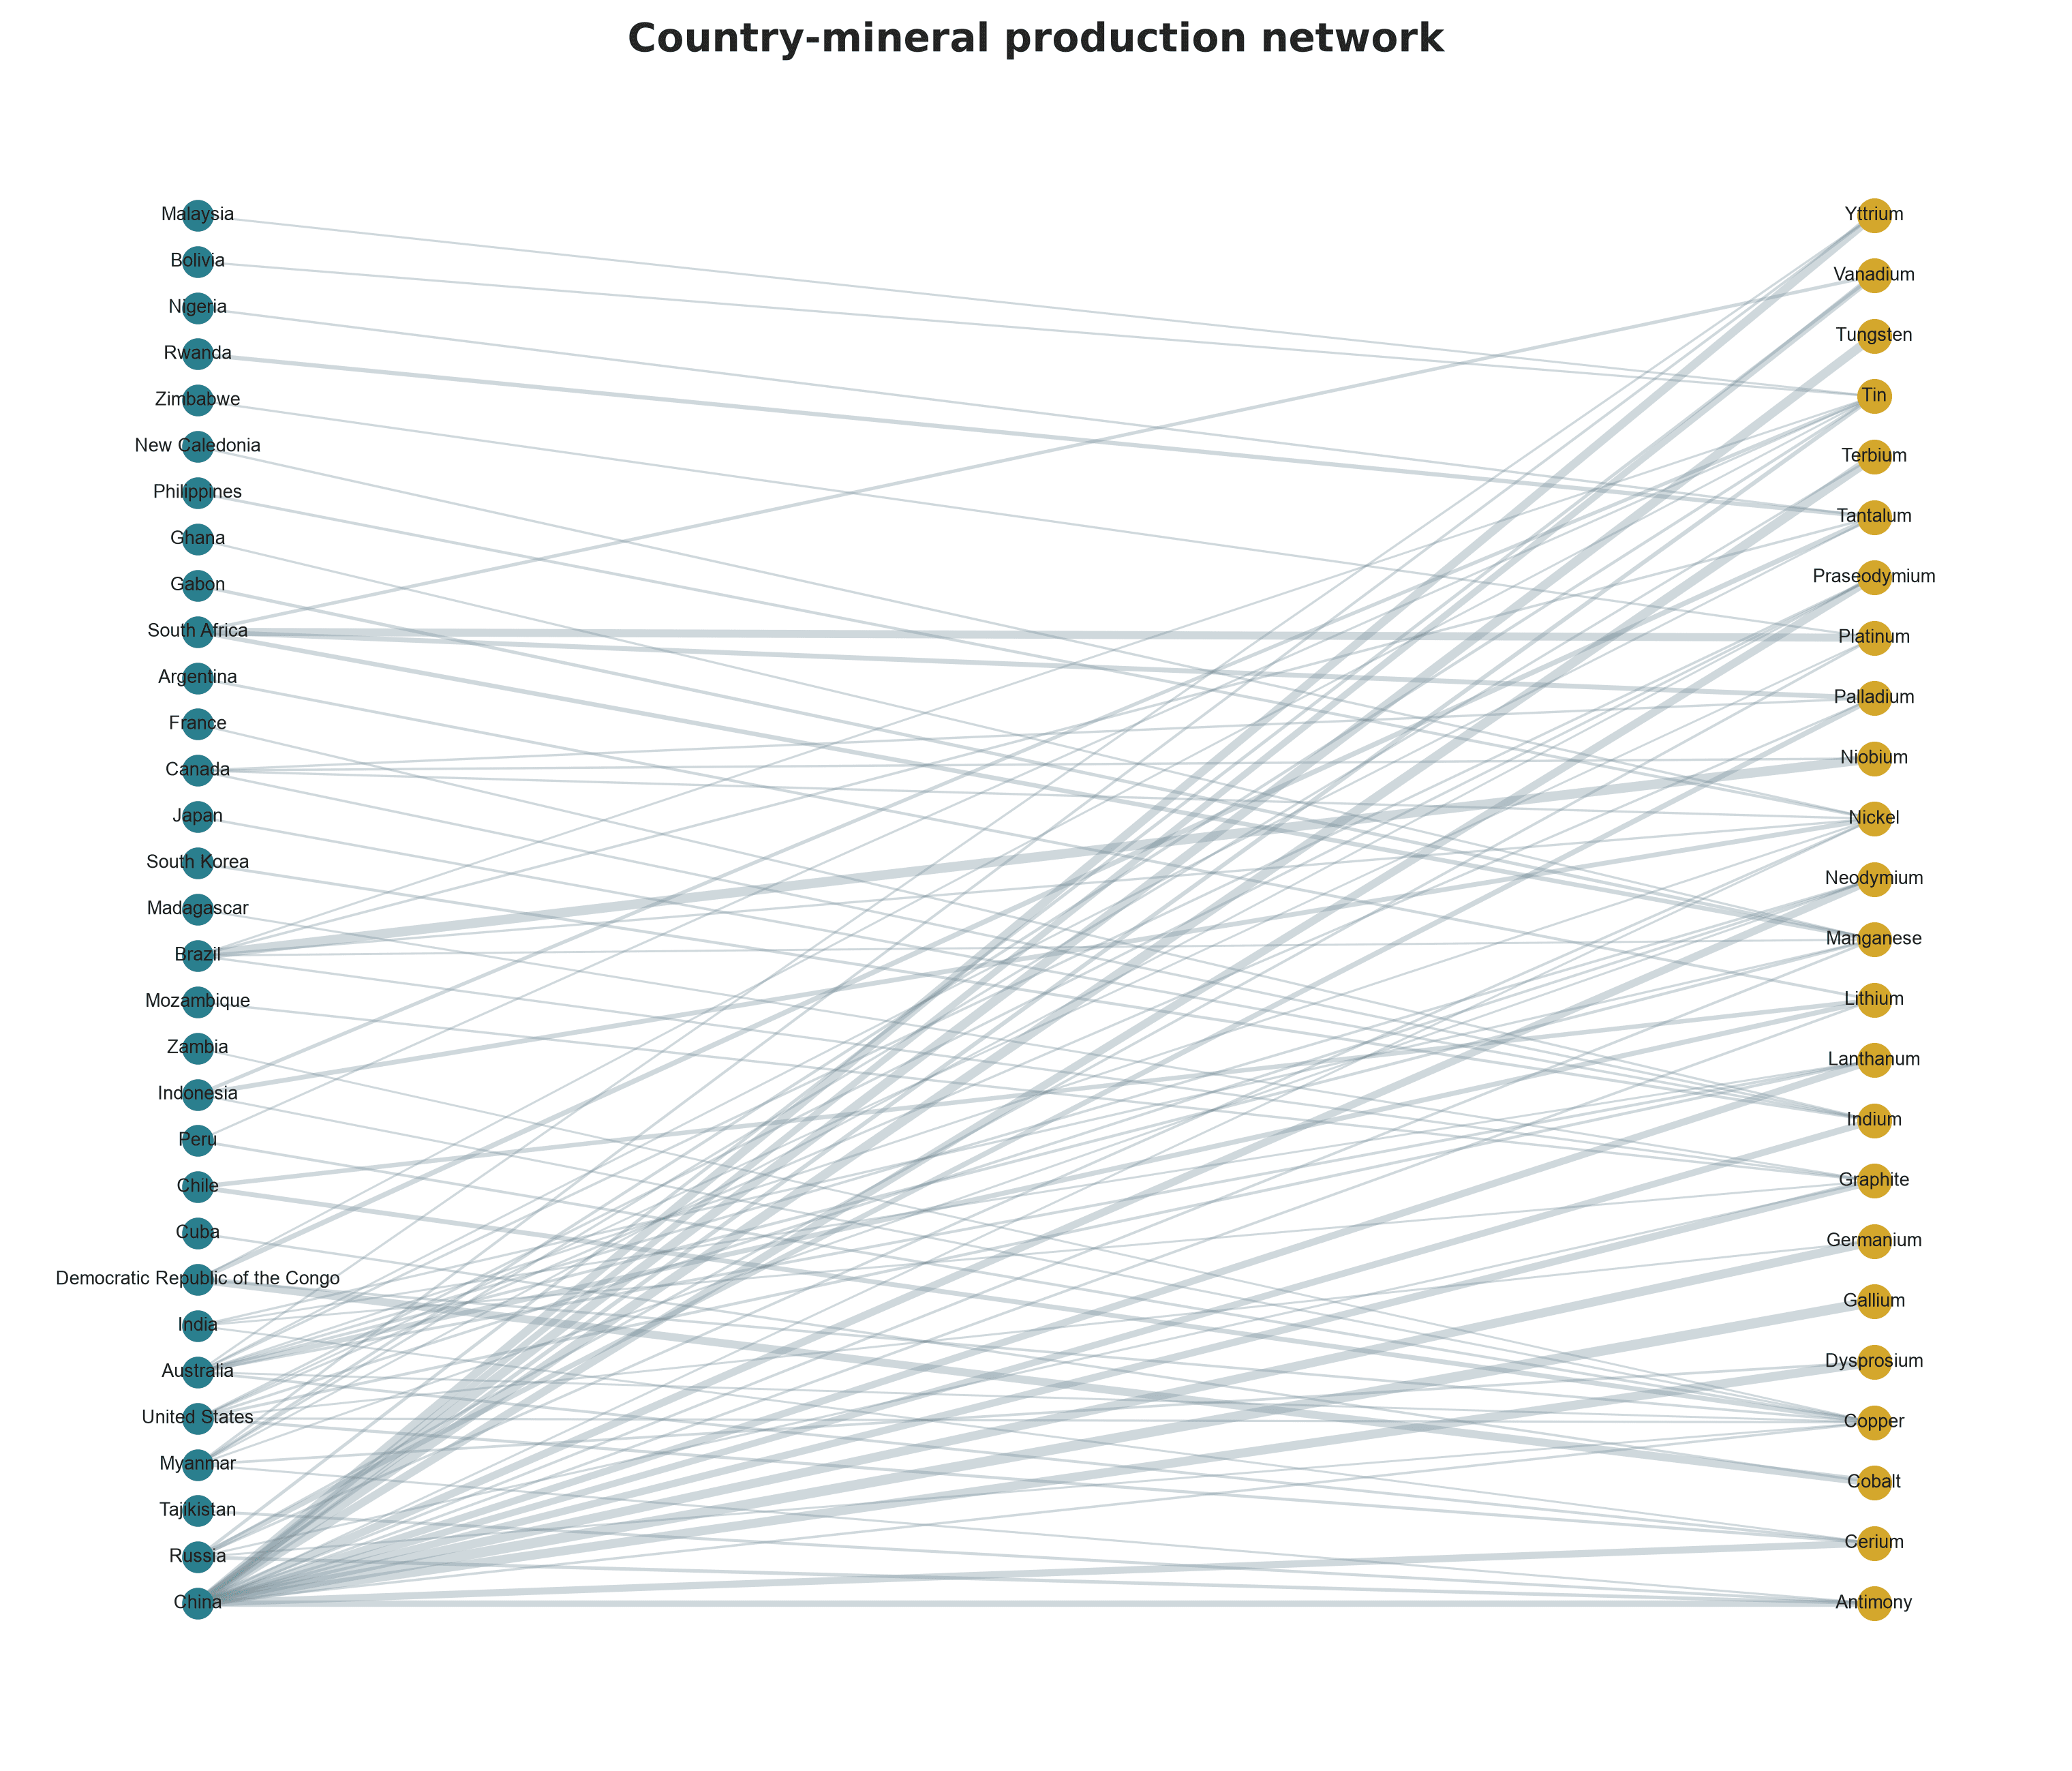
InterpretationChina combines large mineral shares with exceptional cross-mineral breadth, making it the unique systemic node in this panel.
LimitationThe network represents mine-production shares and omits trade routes, refining, inventories, and substitution.
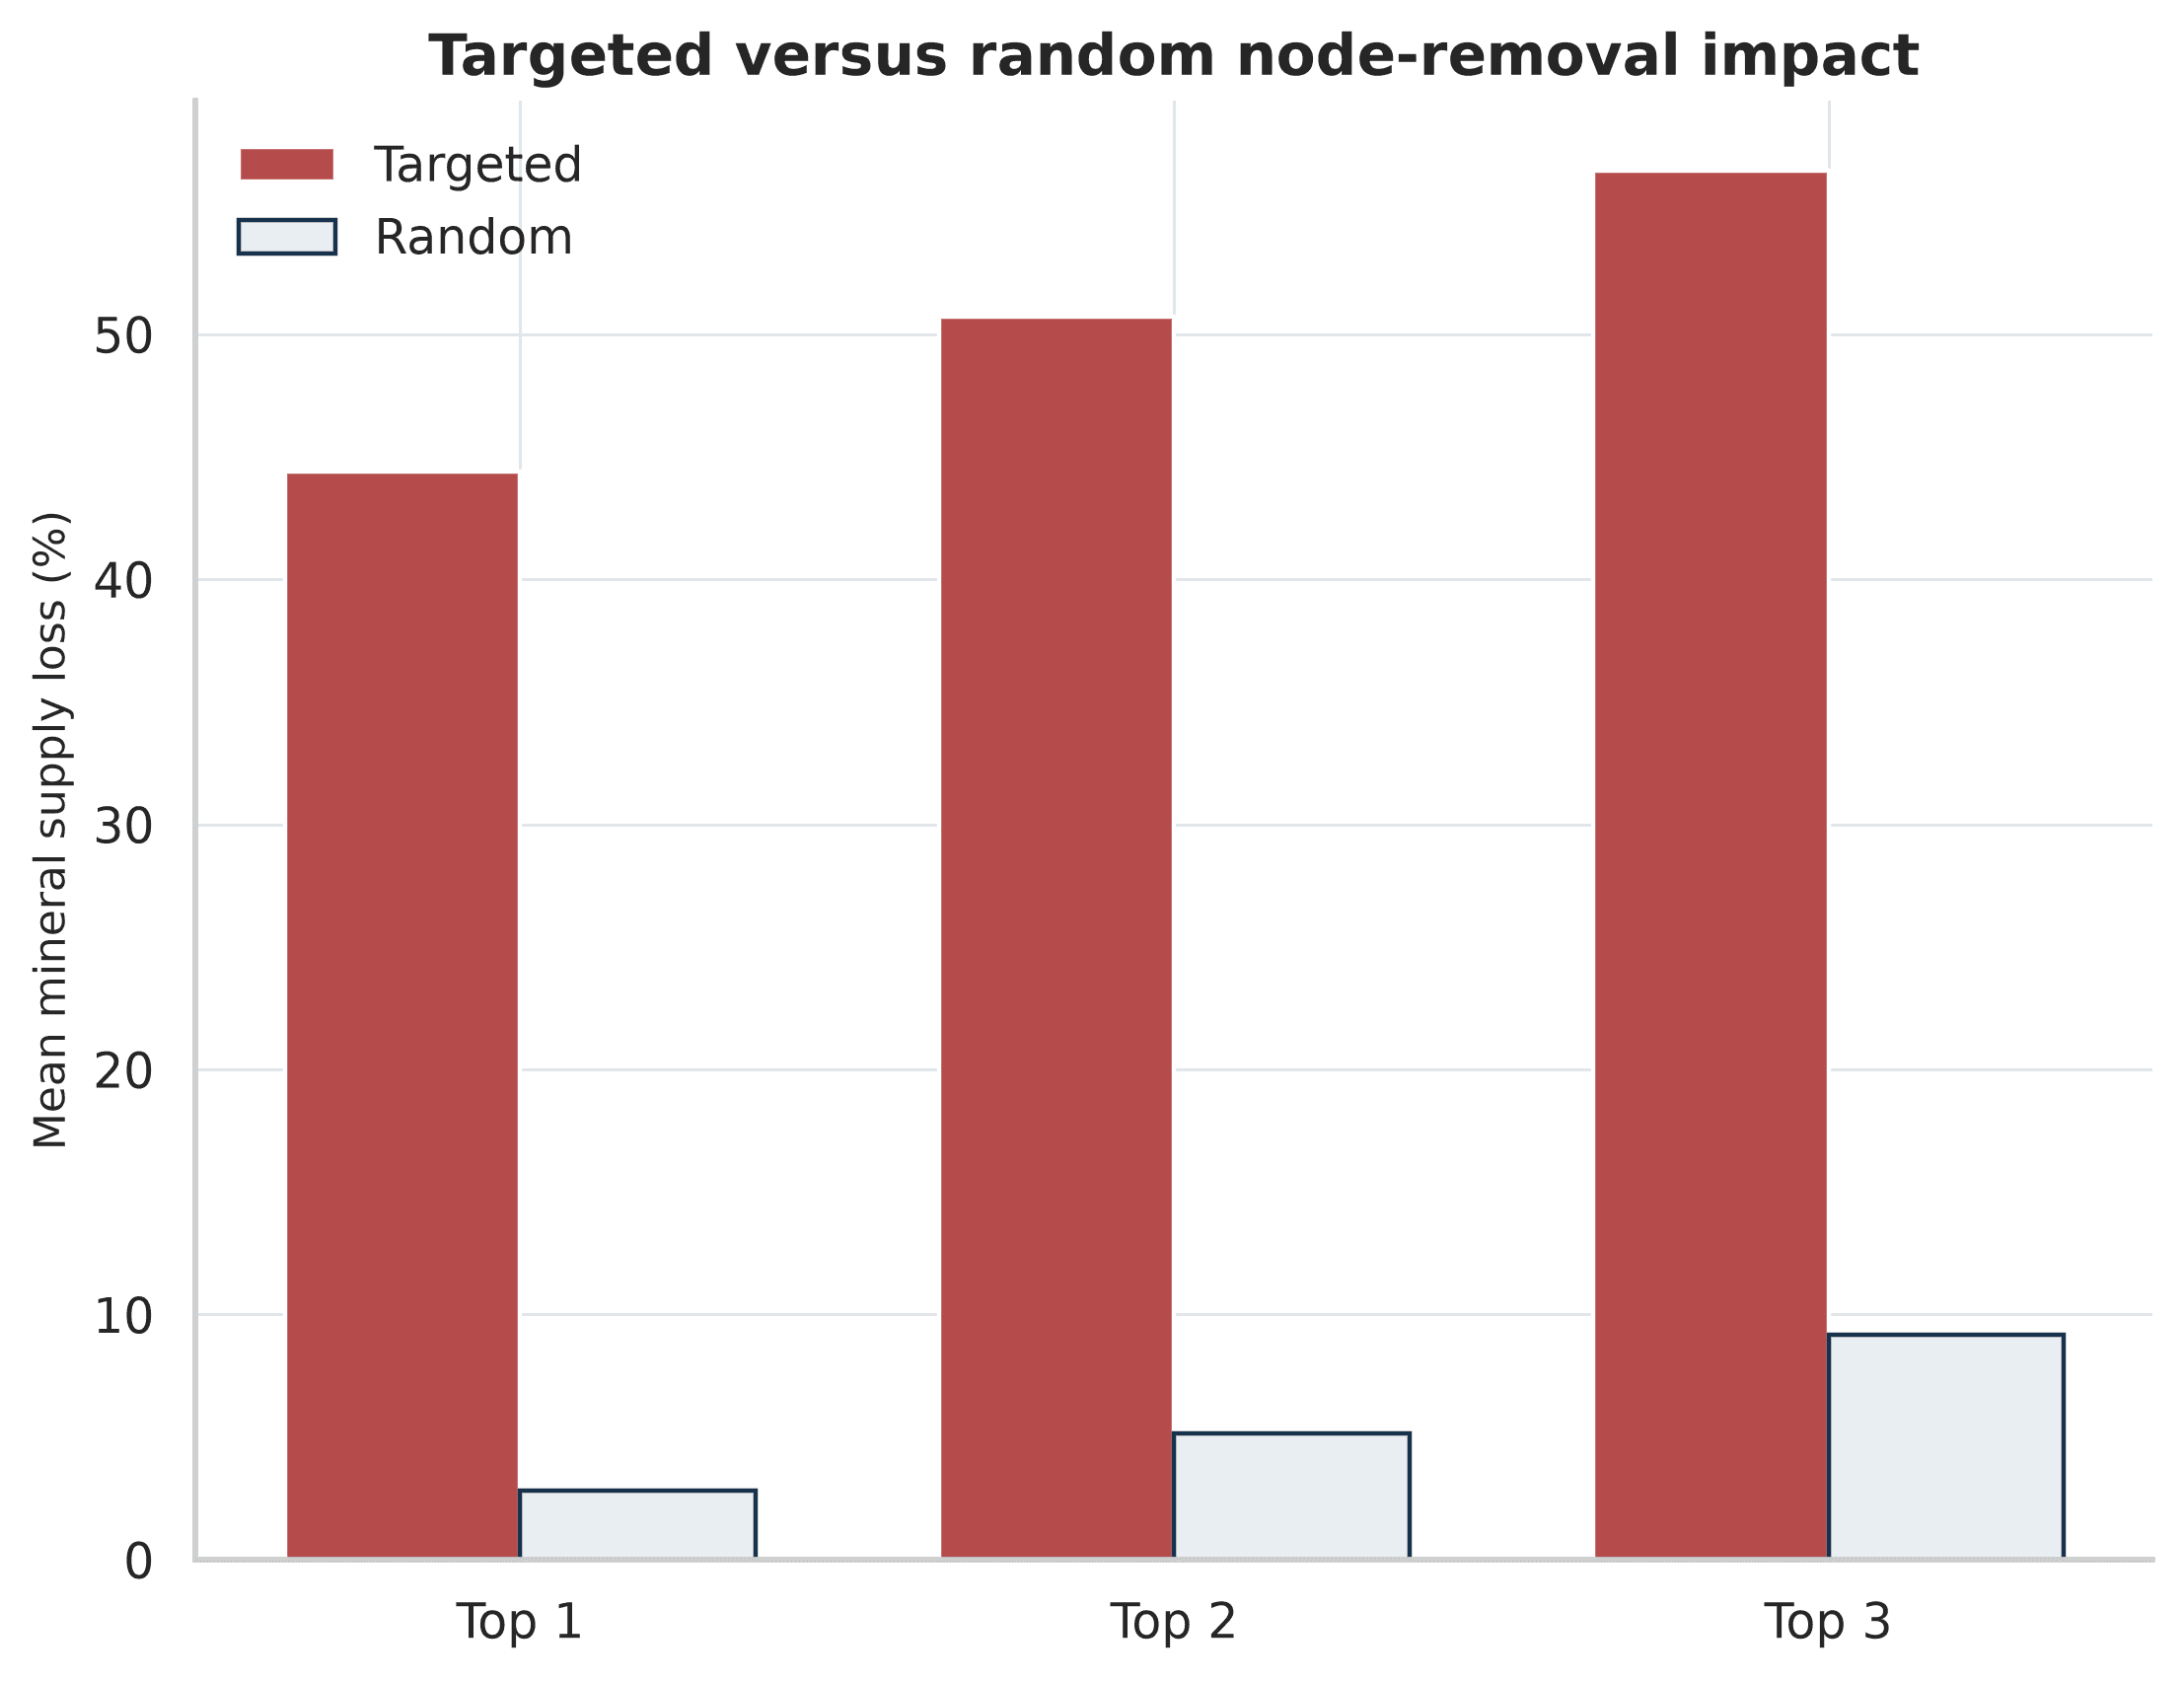
InterpretationRemoving the most systemic countries creates far larger average mineral supply losses than equal-size random removals.
LimitationNode removal is a standardized structural experiment, not a forecast that a country will stop producing.
Vulnerability index
The six-component equal-weight CMVI combines concentration, dominant dependence, volatility, growth pressure, network dependency, and reserve vulnerability. Its ranking correlates strongly with the PCA alternative (Spearman 0.854) without treating either weighting system as objectively correct.
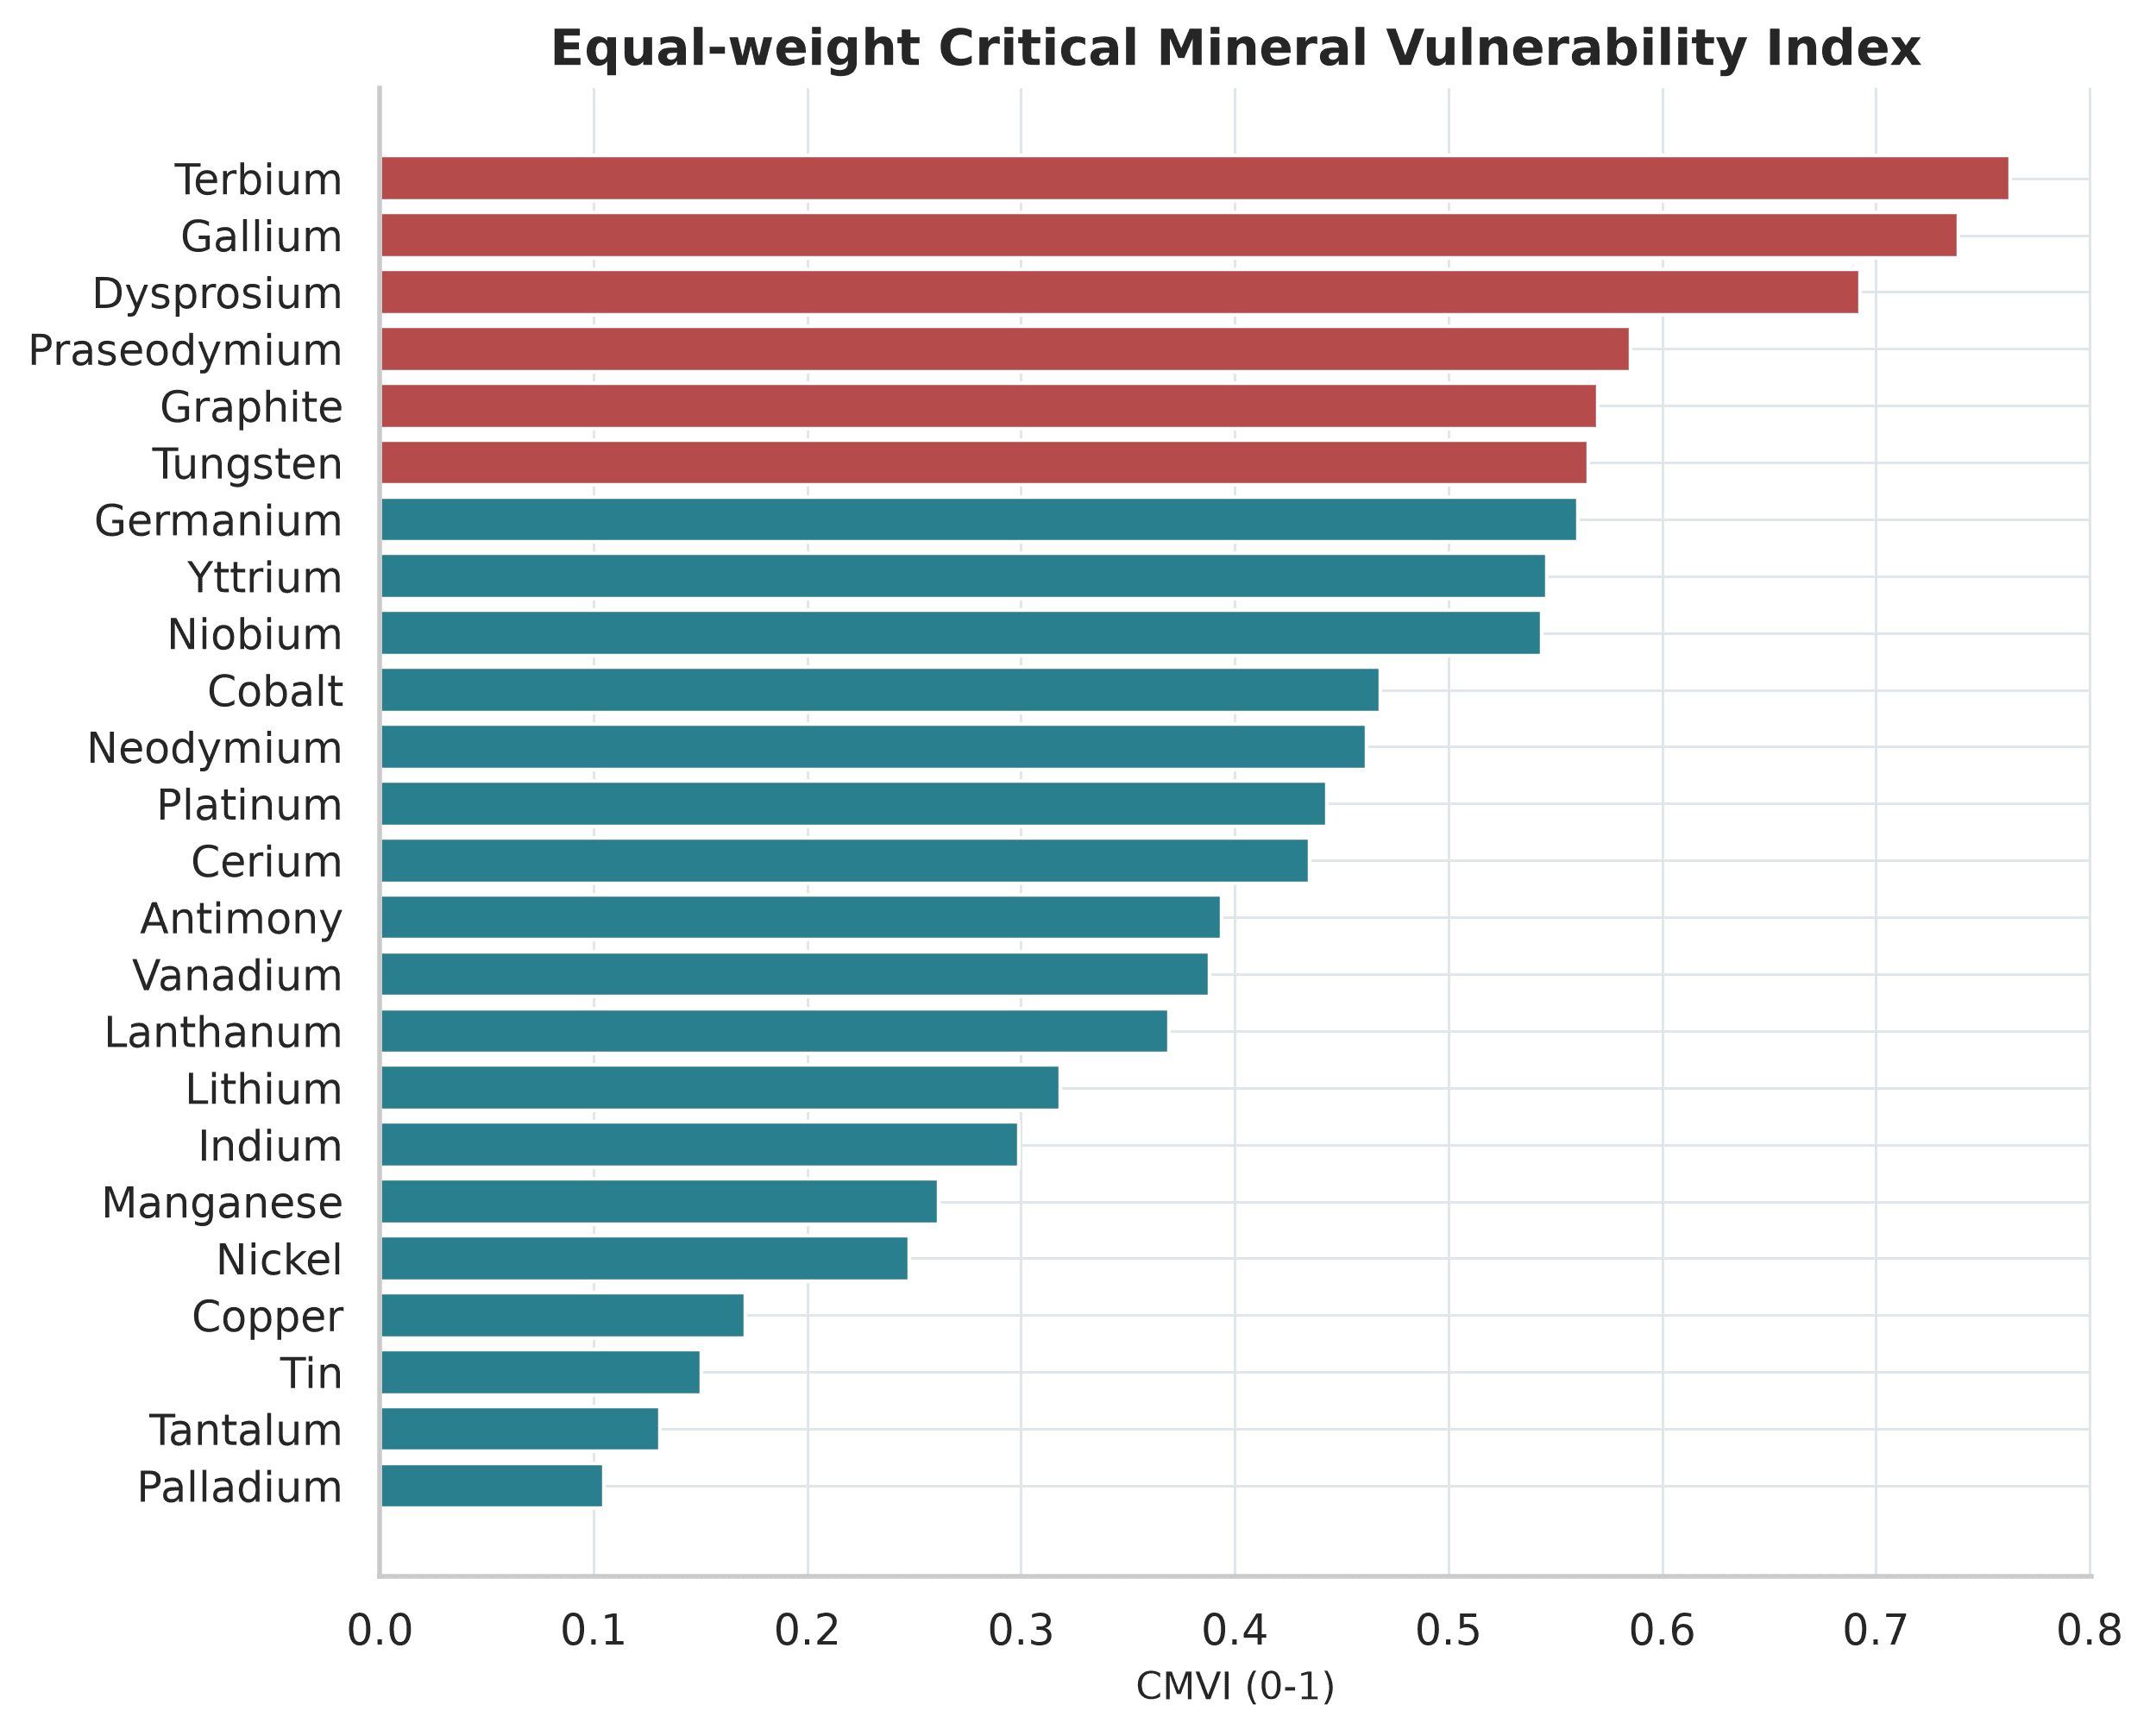
InterpretationThe index makes six declared structural dimensions comparable without presenting the score as an event probability.
LimitationEqual weights are transparent assumptions, not estimated welfare weights.
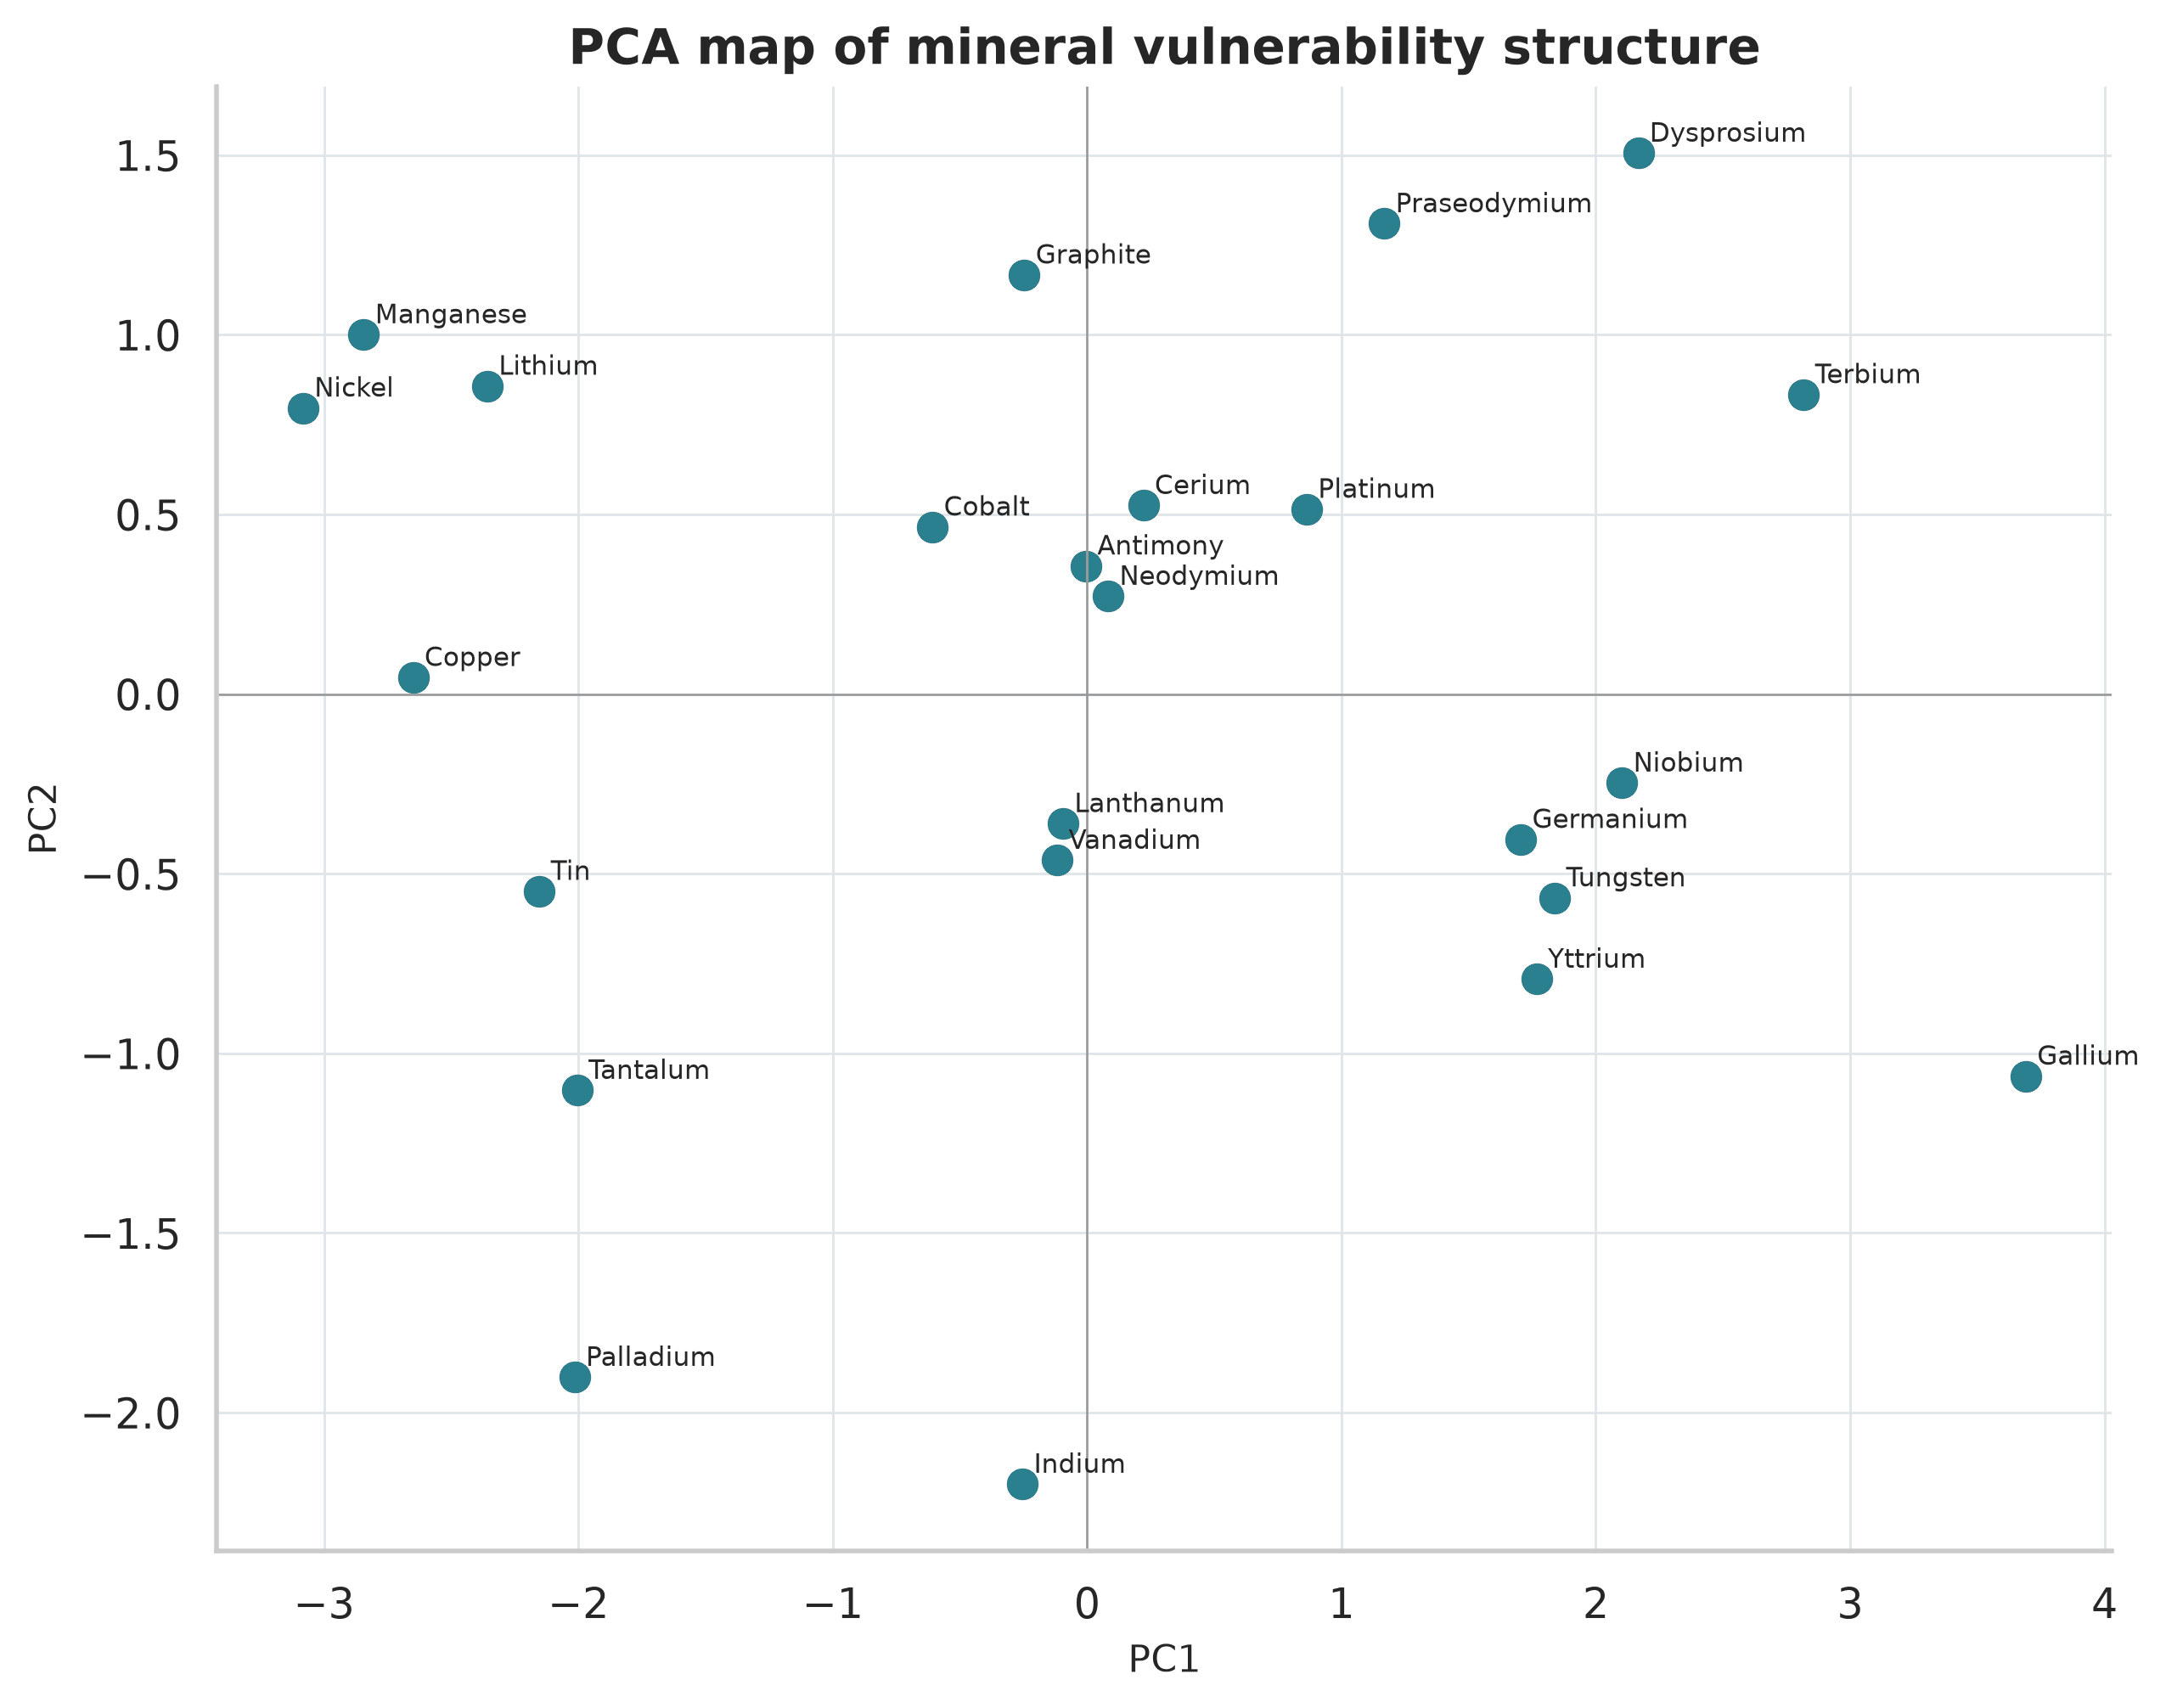
InterpretationMinerals near one another share similar measured concentration, volatility, reserve, and network profiles.
LimitationPCA summarizes measured dimensions and cannot recover supply-chain factors missing from the source.
Supply shocks
A 50% disruption to the largest producer removed 31.2% of supply for the median mineral. In the medium Monte Carlo regime, Gallium's SupplyCVaR95 reached 61.6%, followed by Terbium at 55.8%, Tungsten at 53.8%, Dysprosium at 53.1%, and Germanium at 53.1%.
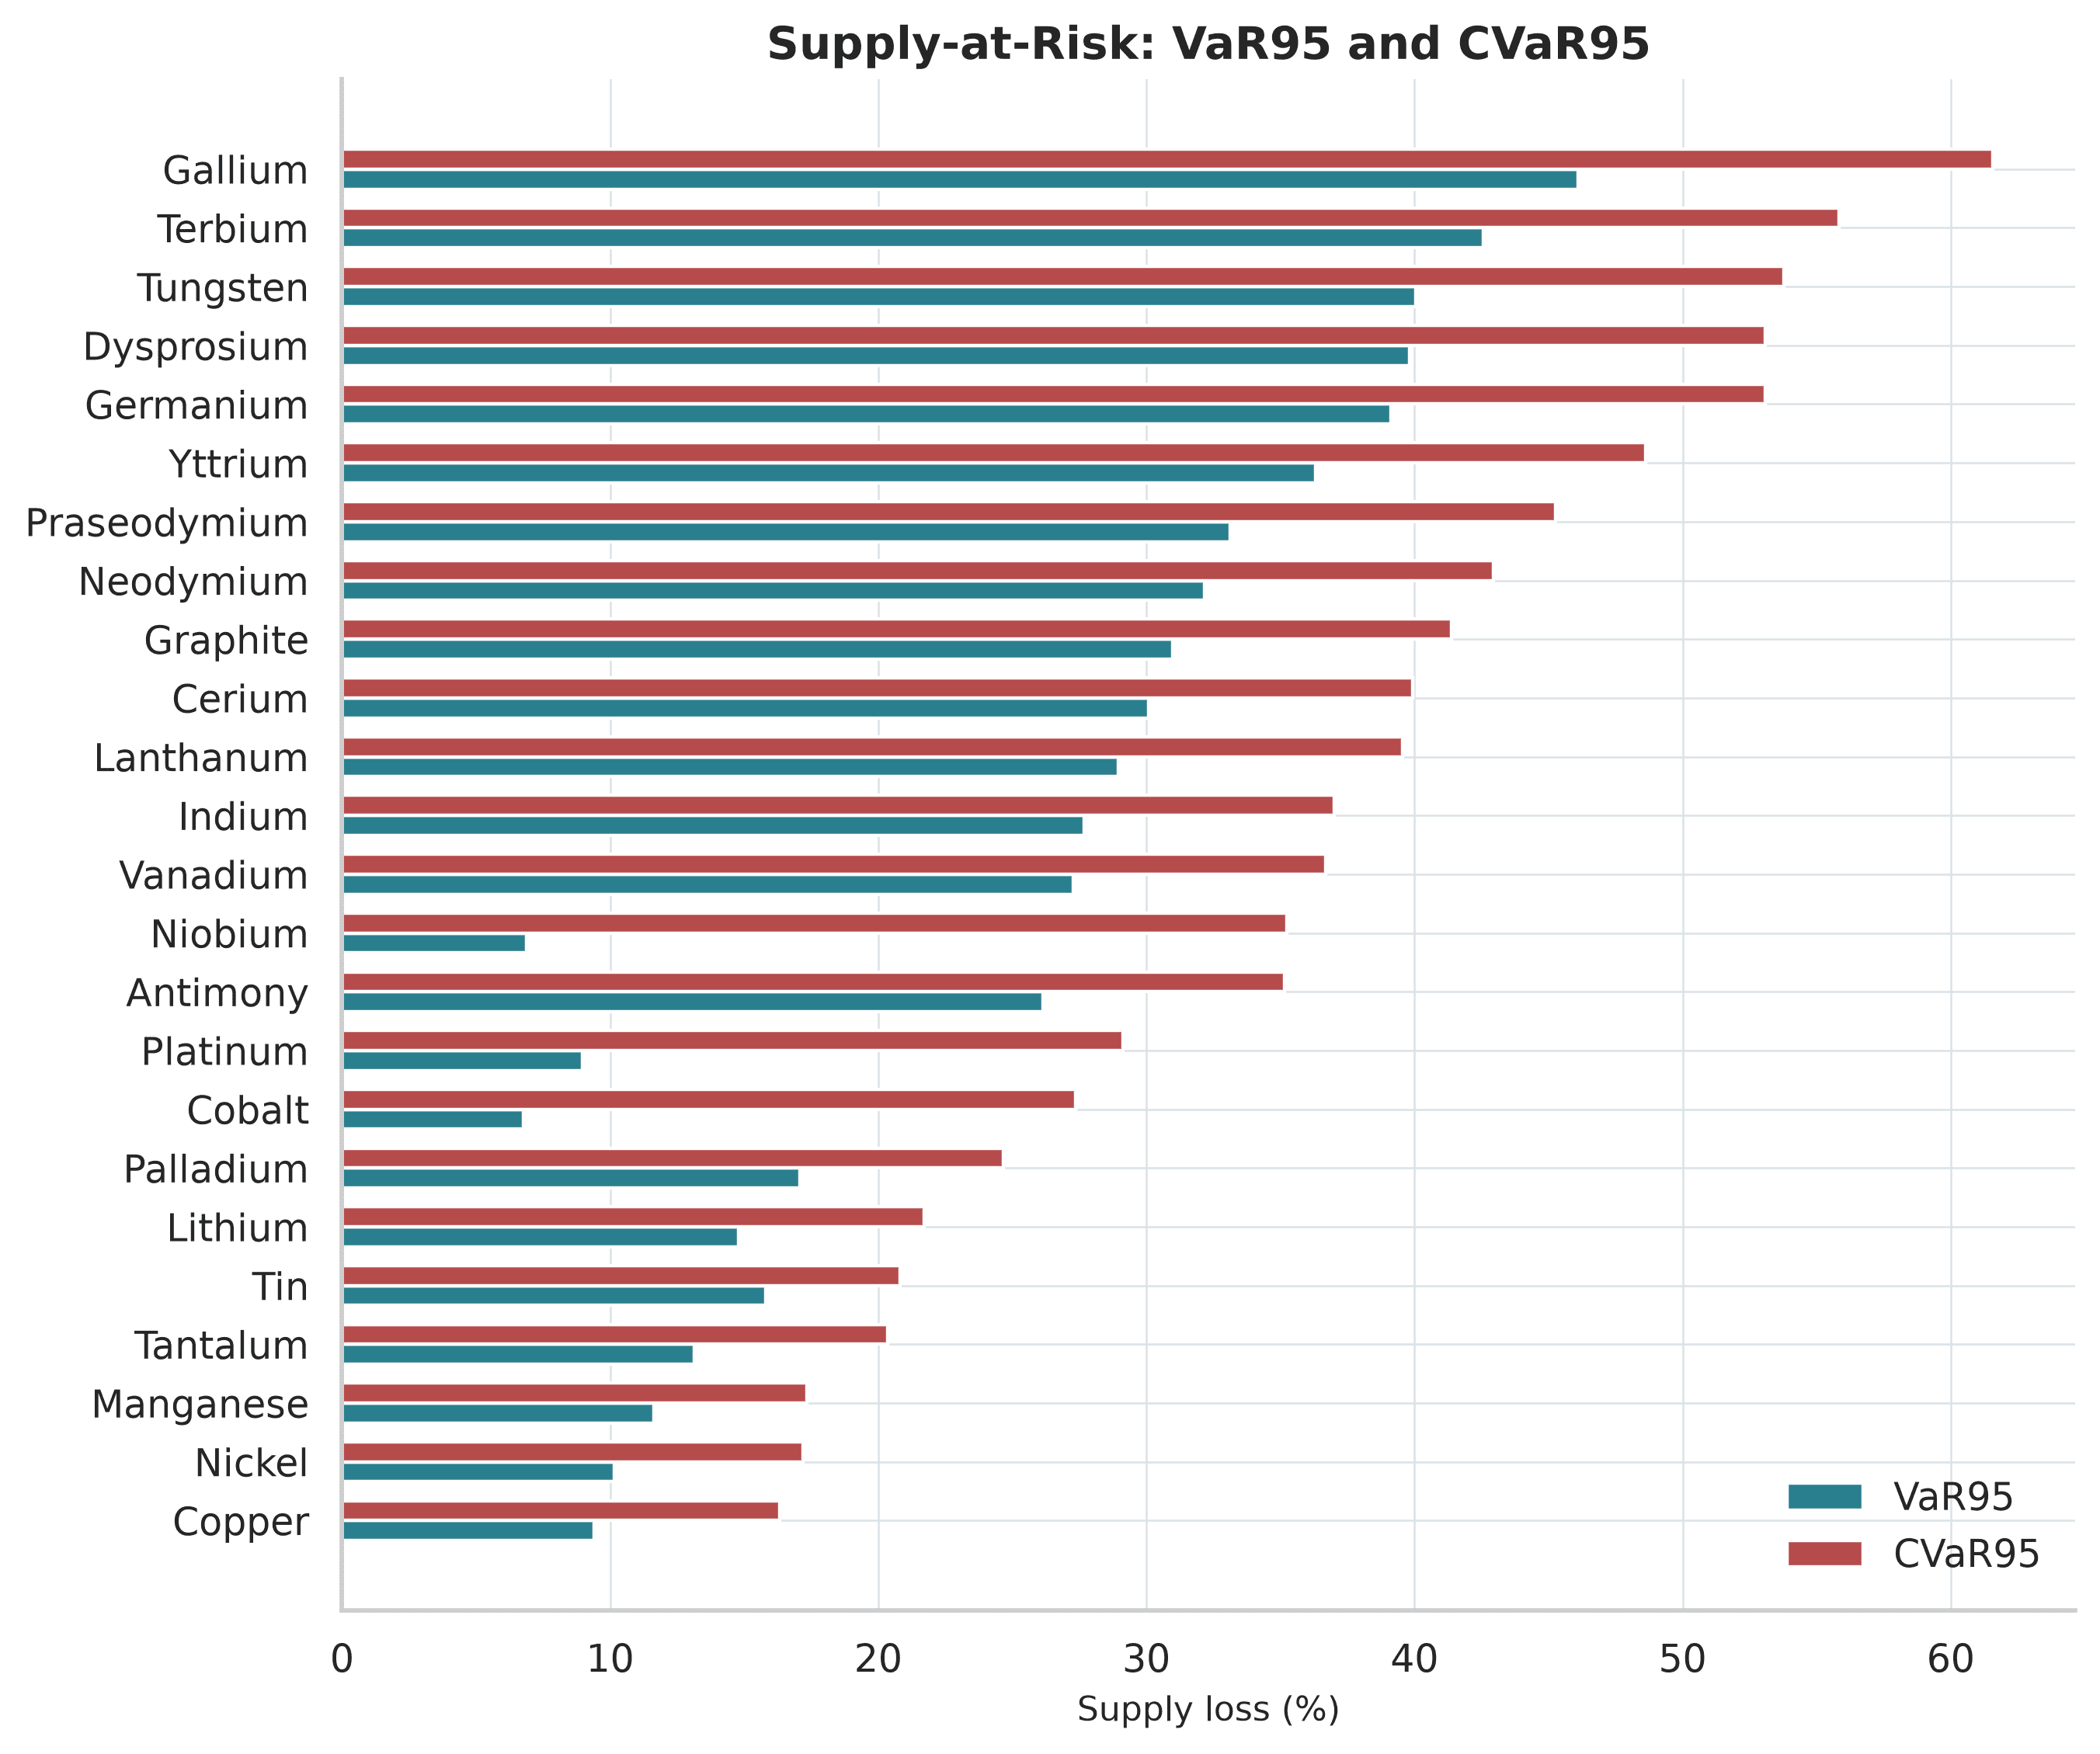
InterpretationThe same concentrated mineral group remains exposed when the analysis shifts from point shocks to stochastic tail loss.
LimitationStress probabilities and severities are declared scenarios, not fitted geopolitical probabilities.
Predictive modeling
The temporal target is next-year medium-regime SupplyCVaR95, derived from the same structural system. Whole-year splits prevent future leakage: 168 training, 48 validation, and 48 untouched test rows. Linear Regression reached test MAE 0.008, R² 0.994, and rank correlation 0.995.
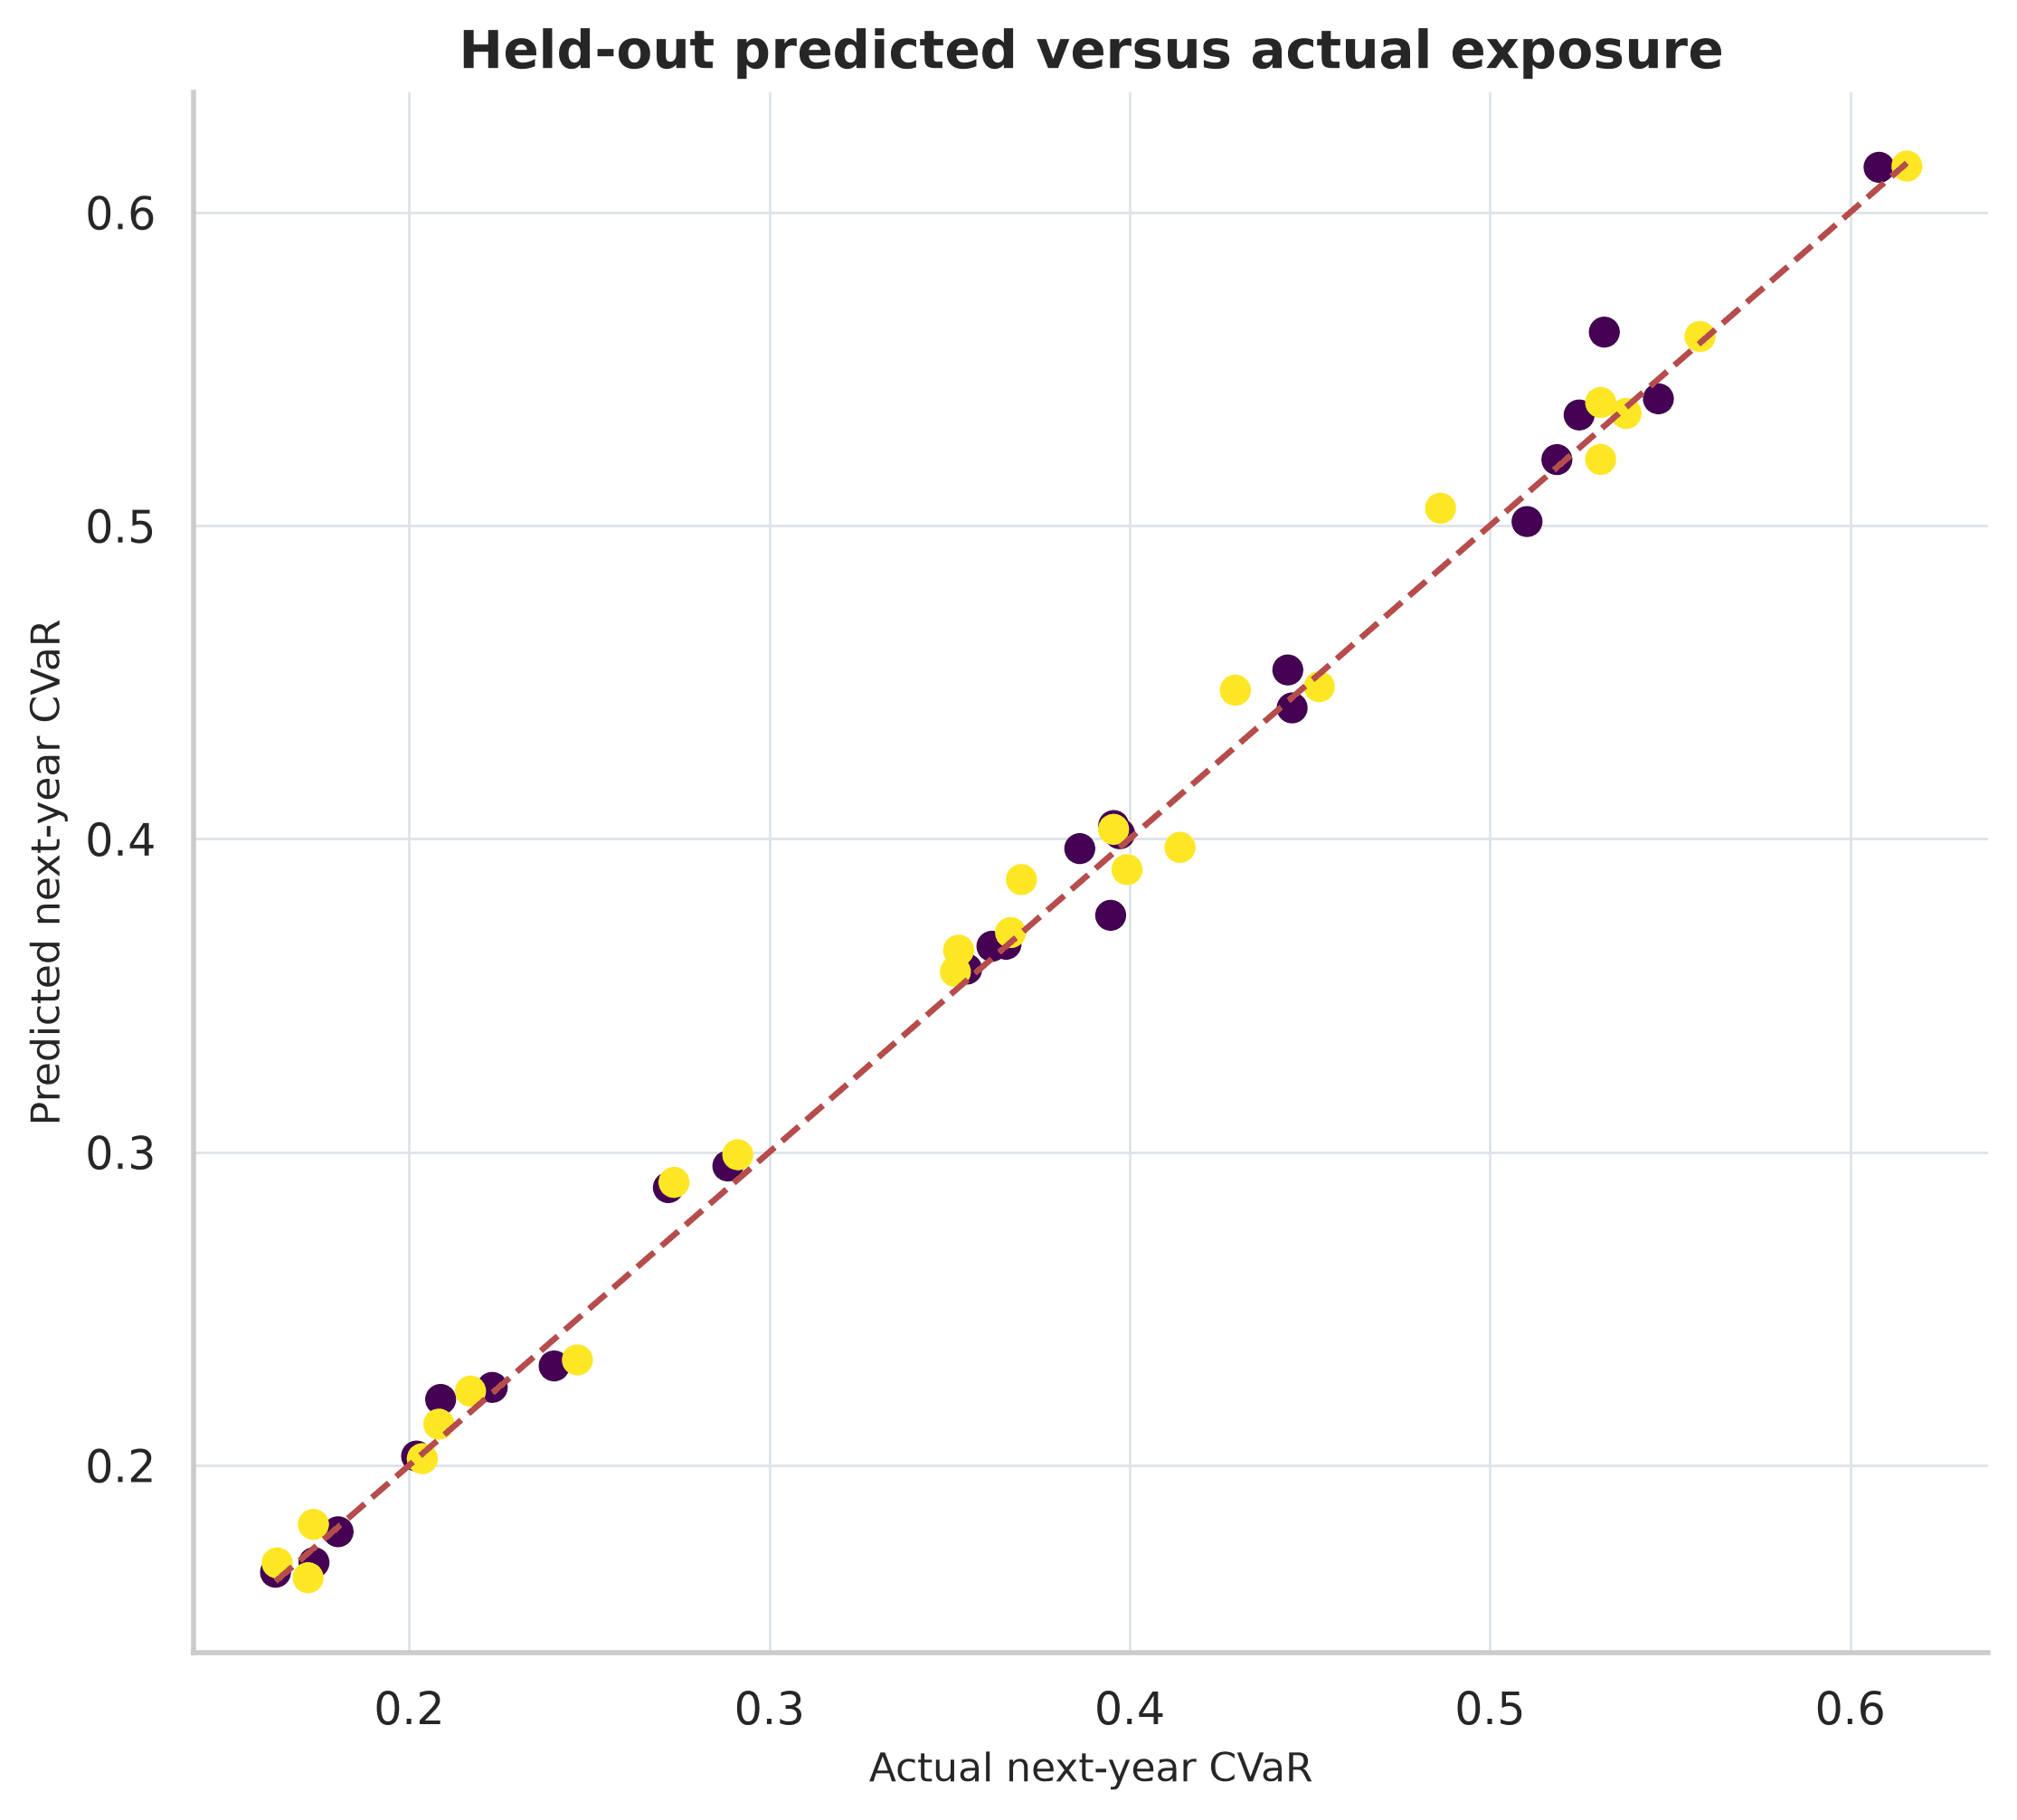
InterpretationThe temporally held-out predictions closely recover the declared structural stress target.
LimitationAccuracy against a simulated target does not establish accuracy against real disruptions.
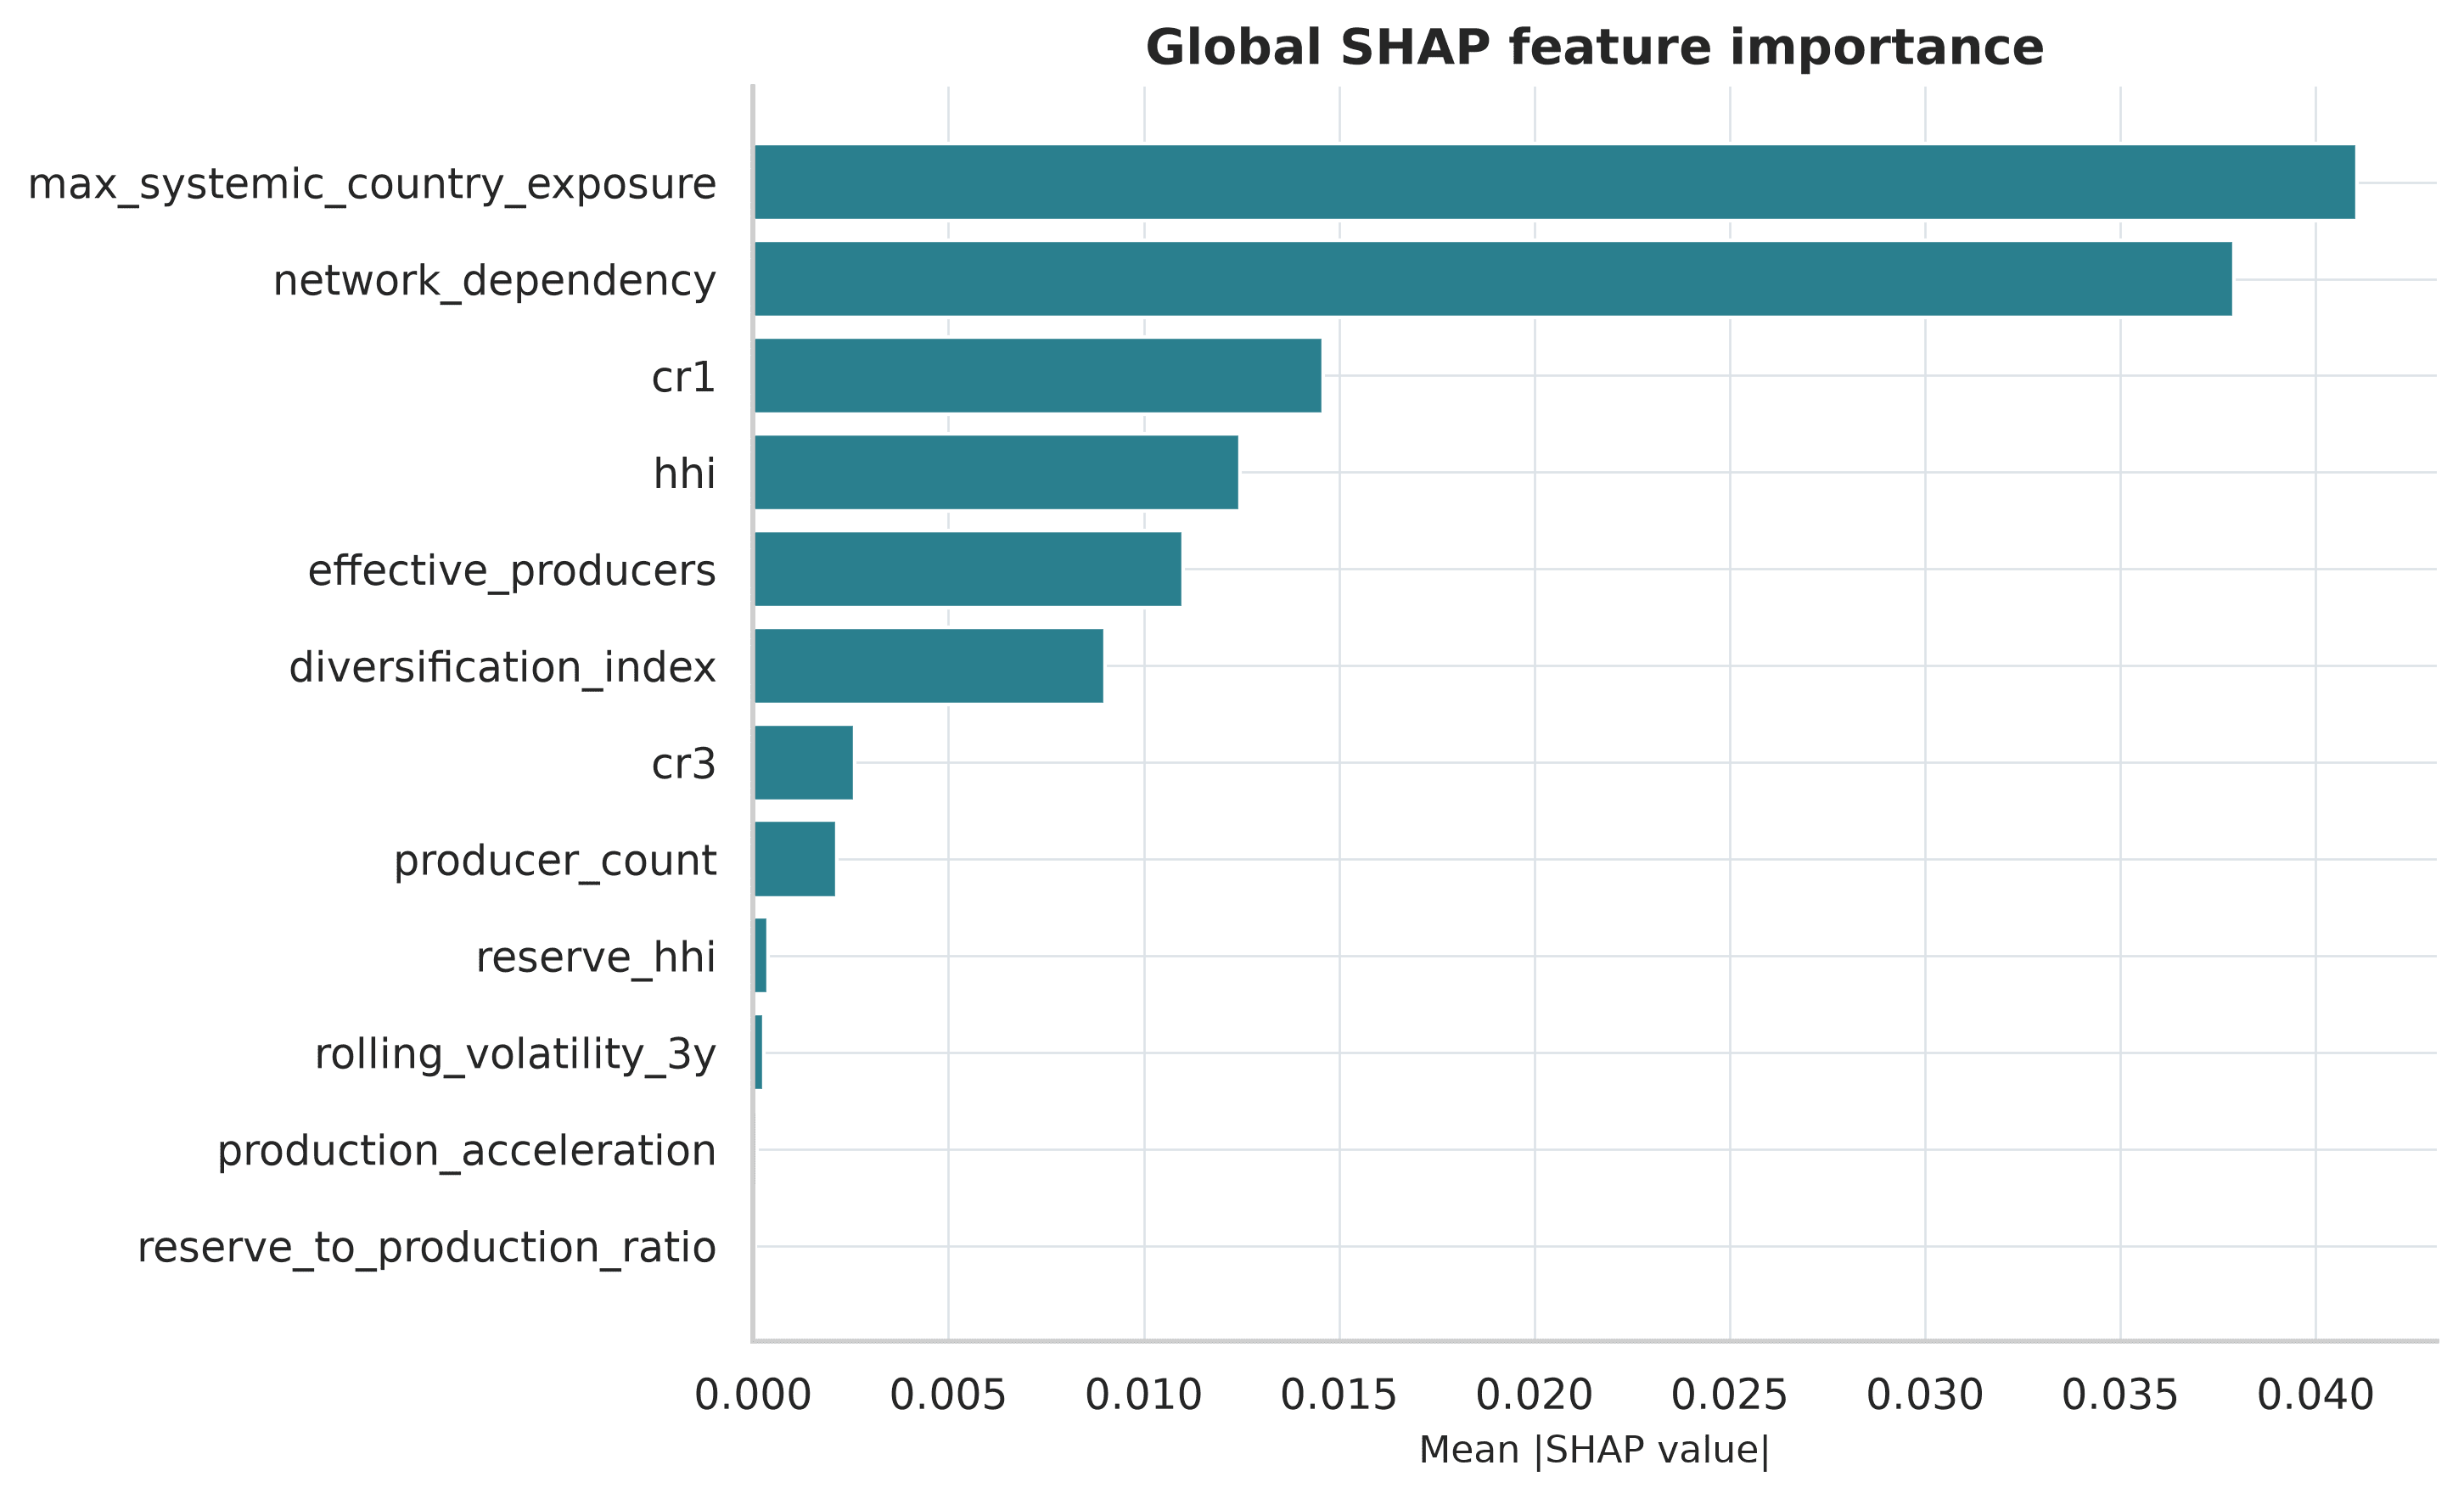
InterpretationNetwork exposure, CR1, and HHI dominate the model's reconstruction of next-year structural tail exposure.
LimitationSHAP explains model reliance and does not establish causal effects.
Robustness
Rankings were compared across HHI and entropy, CR1 and CR3, equal-weight and PCA indices, three network thresholds, three Monte Carlo regimes, alternative shock magnitudes, winsorized volatility, percentile normalization, and alternative temporal splits. Low-to-medium and medium-to-high CVaR rank correlations were 0.922 and 0.978.
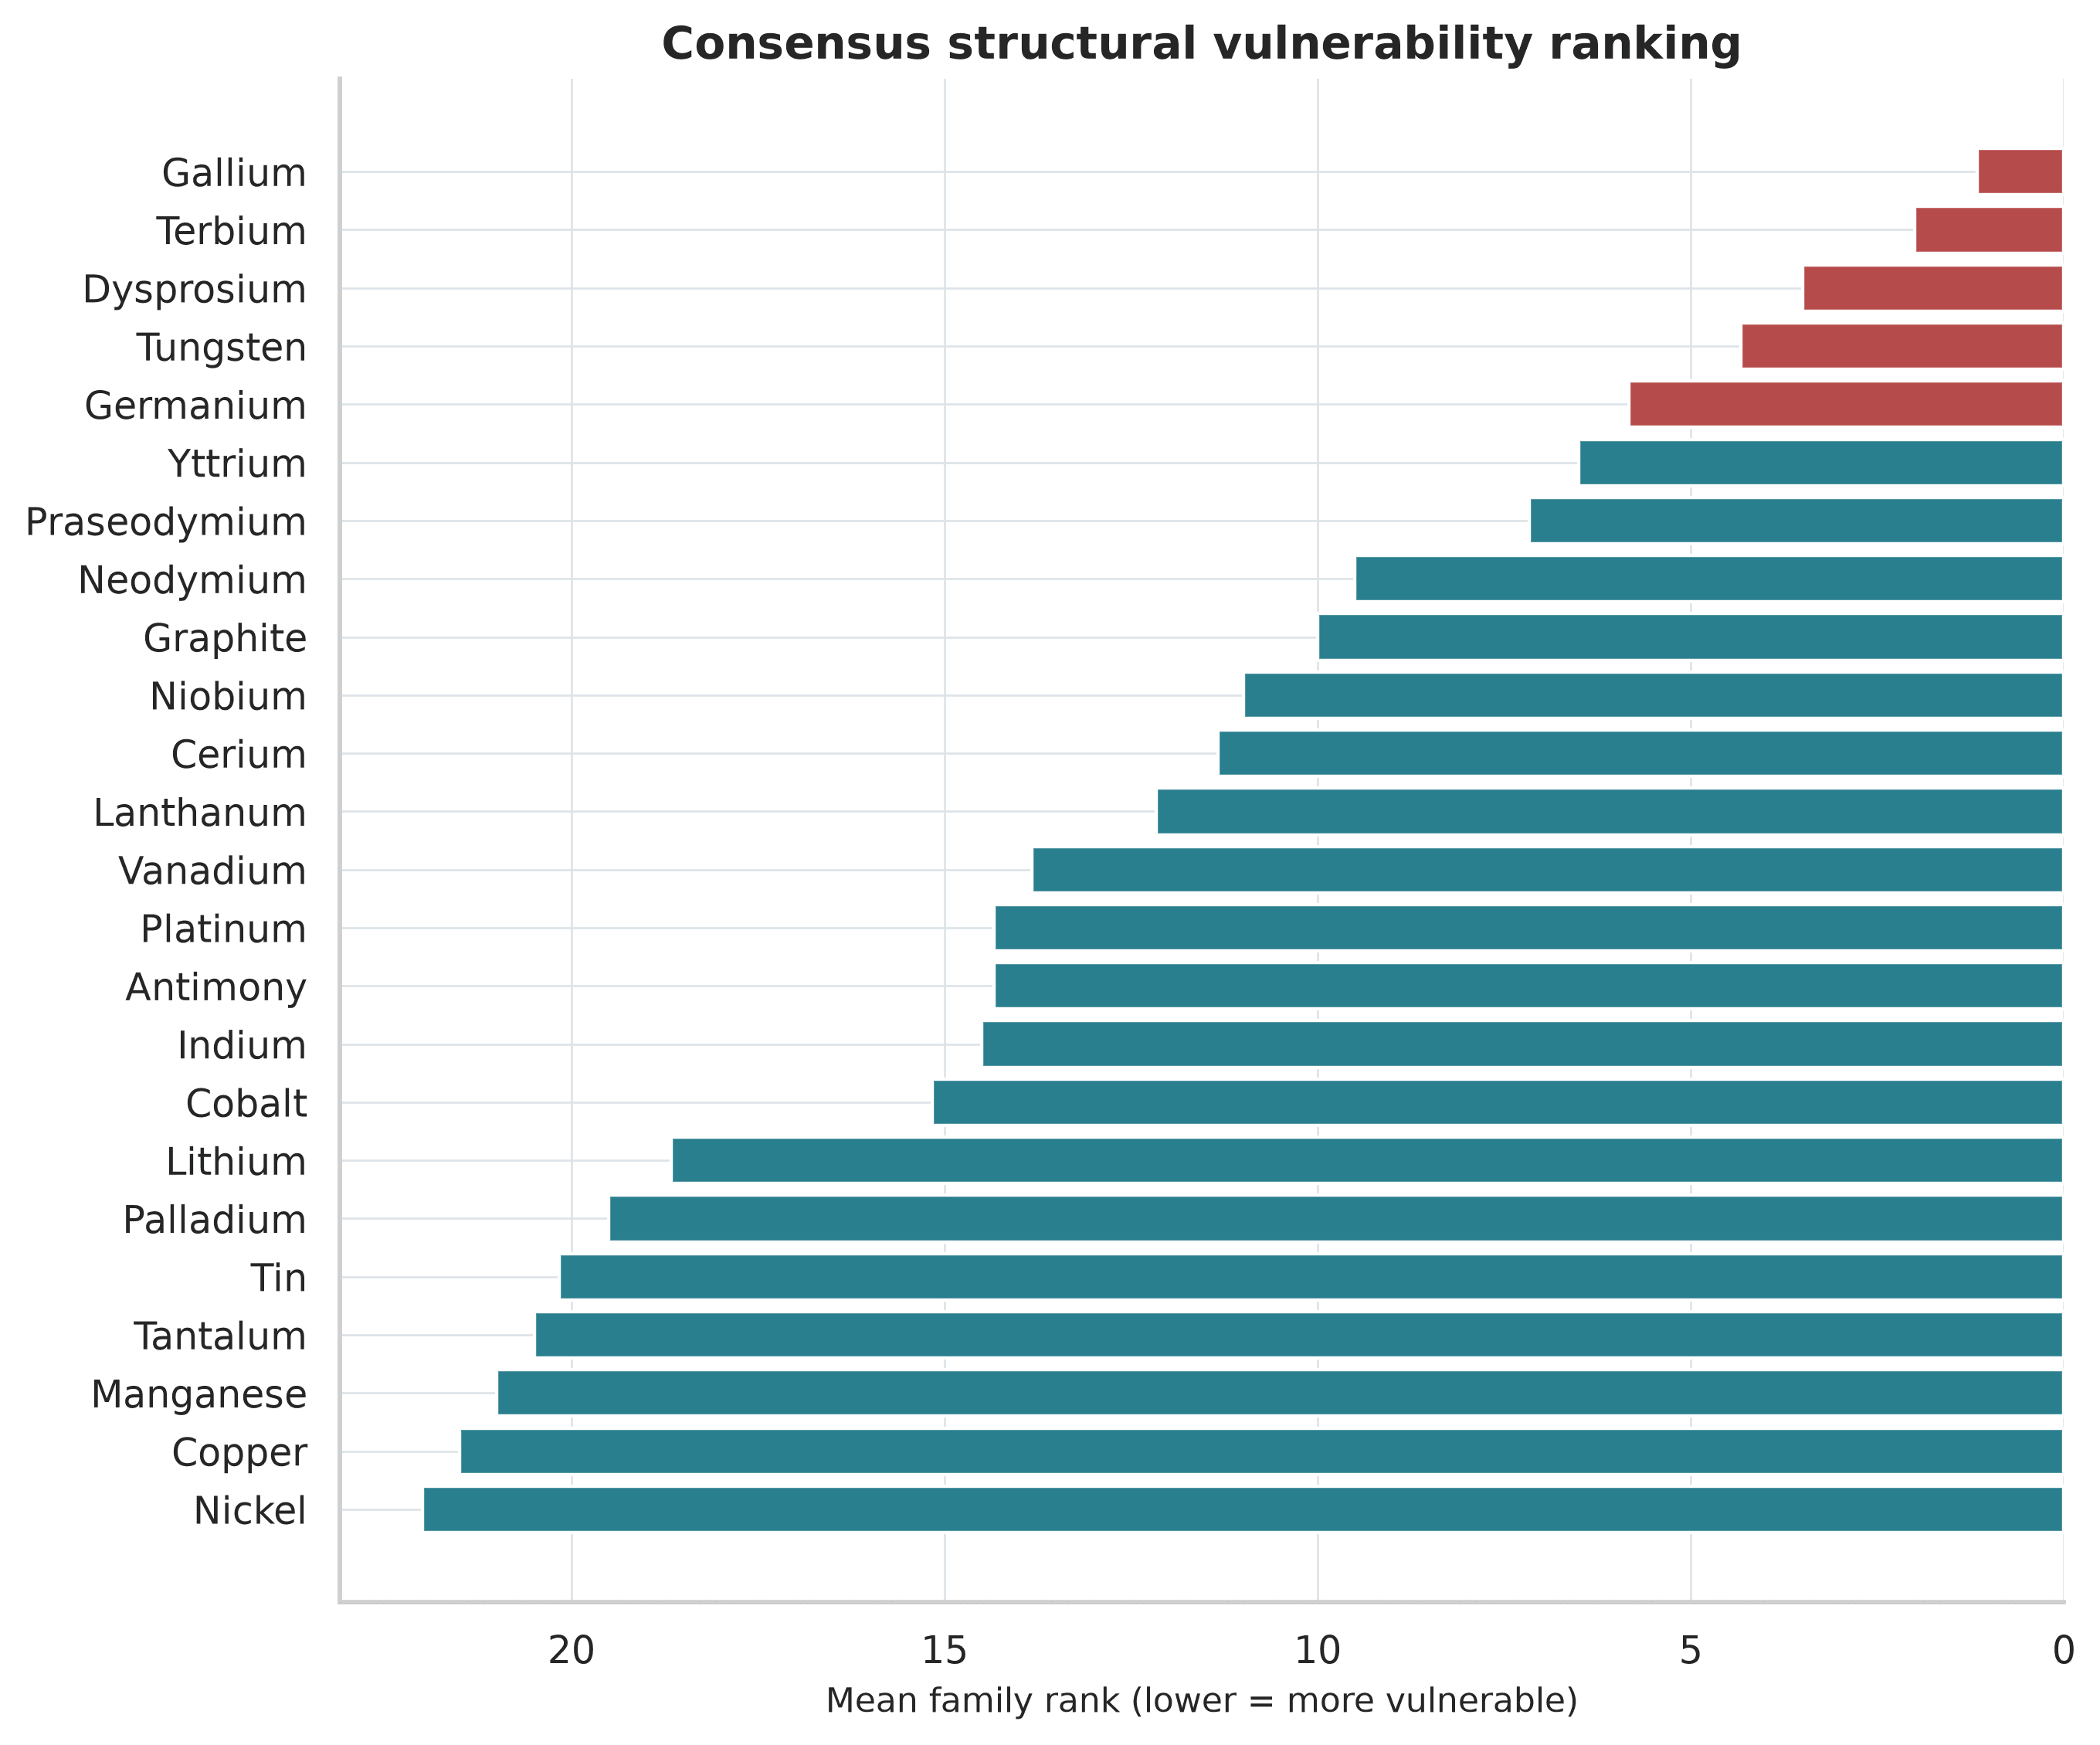
InterpretationBorda-style aggregation keeps one favored index or scenario from determining the final ordering.
LimitationConsensus can reduce method dependence but cannot correct shared omissions in the underlying data.
Limitations
Conclusion
The main result is structural: modest panel-wide diversification coexists with a small, stable group of highly concentrated minerals, and their exposure is amplified by dependence on a shared systemic country node. Gallium, Terbium, Dysprosium, Tungsten, and Germanium remain most exposed across concentration, networks, simulated tail loss, composite indices, and temporal modeling. The framework is ready to be rerun on audited production and refining data for real-world inference.
References
- [1]
Nefedov, S. (2026). Critical Minerals and Rare Earths (2015-2026). Kaggle dataset. Source
- [2]
U.S. Geological Survey (2026). Mineral Commodity Summaries 2026. U.S. Geological Survey. Source
- [3]
International Energy Agency (2025). Global Critical Minerals Outlook 2025. IEA. Source
- [4]
Graedel, T. E., et al. (2015). Criticality of metals and metalloids. Proceedings of the National Academy of Sciences, 112(14), 4257-4262. Source
- [5]
Lundberg, S., & Lee, S.-I. (2017). A unified approach to interpreting model predictions. NeurIPS 30. Source
Complete paper
The complete 32-page paper contains the full methods, results, tables, references, appendices, and reproducibility notes. Its author line and PDF metadata identify Akshay Byagathvalli.